Visualization Tool B.One Gallery – An Introduction

Photo collage with screenshots of various diagrams from the B.One Gallery
- 📖🕓 ≈  5 min -

You have already learned a lot about using the B.One Gallery in other blog posts. For example how you can create your own sensors in the Gallery, how simple geofencing can be set up, examples of use cases that can be implemented with it andwhat the Gallery has to do with the B.One Middleware, the ZENNER Shop, the ZENNER IoT PLUG&PLAY option, the ZENNER IoT Gateways and the B.One Community. But you haven’t read them (yet) or are you still wondering what the B.One Gallery actually is? Then this post is just right for you.

B.One Gallery in a Nutshell

In short, the B.One Gallery is an easy-to-use, professional and user-oriented tool for visualizing IoT projects/applications or sensor data.

Energy data as a bar chart in the visualization tool B.One Gallery

What is the B.One Gallery used for?

Visualization of Sensor Data

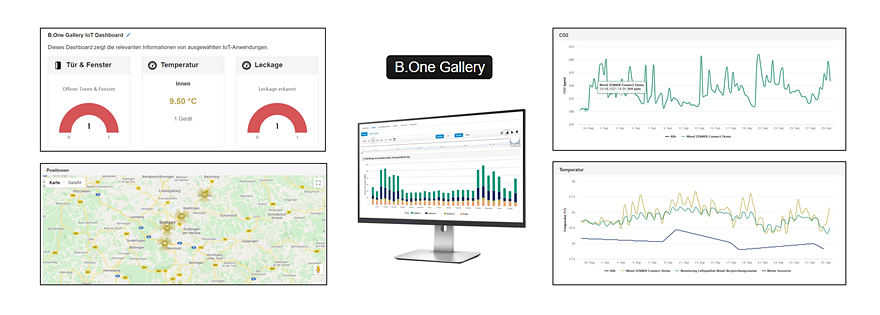
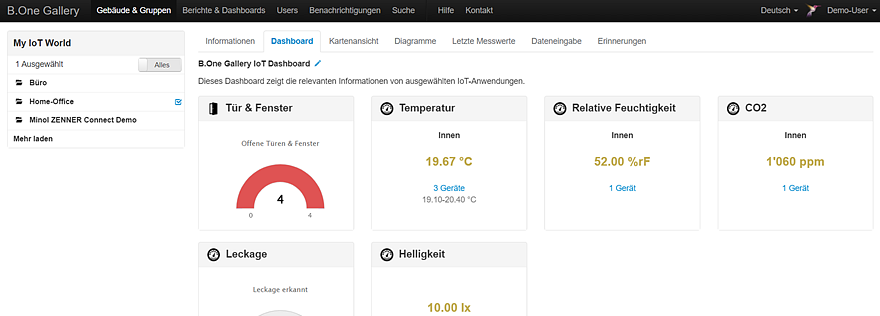
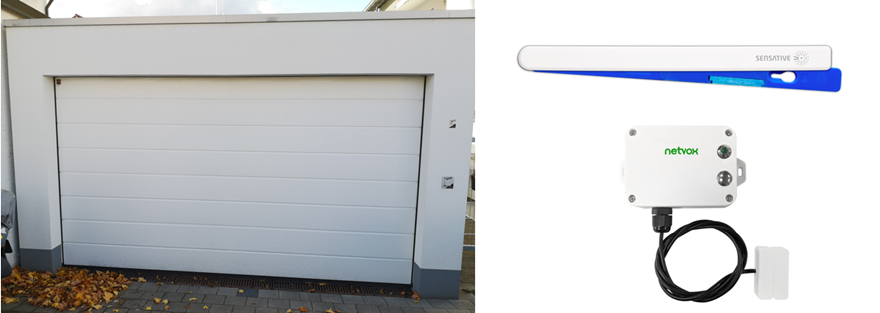
With the help of the B.One Gallery, suitable sensors and a ZENNER IoT GatewayPLUS as a prerequisite (more on this below), you can implement a large number of applications in the Internet of Things and display your data visually without any prior technical knowledge. Simple and user-oriented. Sensor data such as temperature, CO2 level, humidity, opening status of doors, gates or windows, positions of tracked objects and other information are presented graphically in the Gallery in real time and over time on individual dashboards and make them interpretable and analyzable. Below are a few examples.

Visualization of temperature curves in the B.One Gallery
B.One Gallery: Visualization of temperature curves as a line diagram


Visualization of position progressions and routes in the B.One Gallery
B.One Gallery: Visualization of position progressions/routes of tracked objects


Real-time display of the current leakage situation in the B.One Gallery
B.One Gallery: Real-time display of the current states of leakage sensors


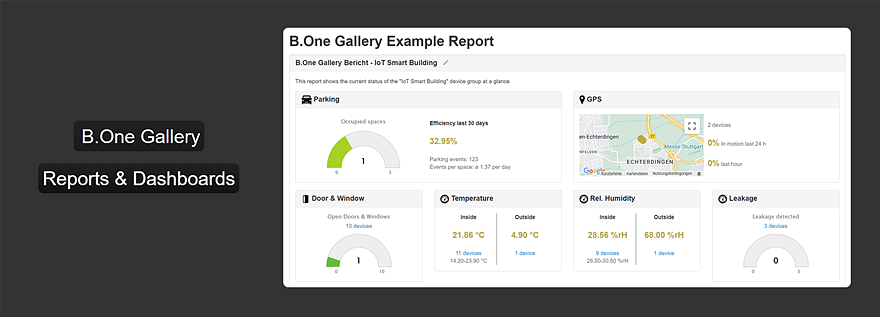
Custom Reports & Dashboards

In order to share your data in a clear form with colleagues, partners, customers or service providers, you can create individual dashboards and extensive reports with just a few clicks. You can easily provide this to the desired groups of people via a web link, with the graphics and values contained there being updated automatically. Unwanted access can be avoided by password protection or by assignment to selected Gallery users.

Here is an example report from the B.One Gallery

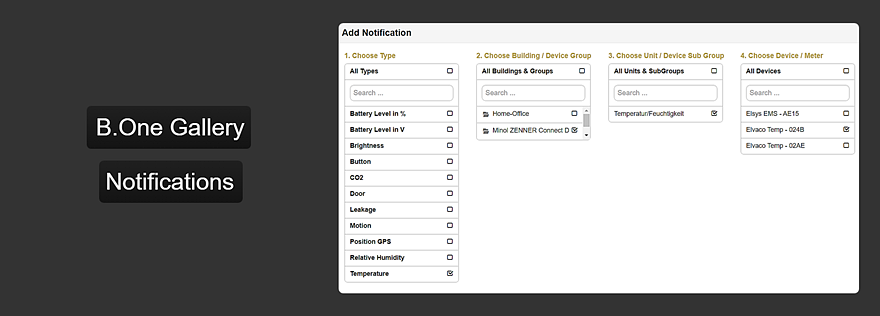
Automatic Notifications

Thanks to the integrated monitoring and notification system, unusual or critical conditions are detected and you are informed immediately via various selectable channels (e.g. email or SMS).

Email notification of critical temperature changes of the B.One Gallery
B.One Gallery: email notification in the event of critical status changes (example: temperature)


You can find out more about notifications in the B.One Gallery and how you can create them in the article “B.One Gallery Howto: Set up & manage notifications“.

Easy Collaboration

The sophisticated user and authorization system enables uncomplicated collaboration between you and your colleagues, partners, customers or service providers. You can create new users in no time at all and grant the appropriate approvals or authorizations.

Time and Location independent Access to Data

The B.One Gallery can be displayed in all modern browsers and requires no installation, manual updates or drivers. This means you can access your data anywhere and anytime.

Interplay of B.One Gallery & B.One Middleware

Interplay of B.One Gallery and B.One Middleware

You have already seen how the two IoT platforms B.One Gallery and B.One Middleware interact with each other in the articles “B.One Community, Gallery, Middleware & ZENNERShop – how is it all connected?” and “B.One Middleware – An Introduction”. Here is a brief summary again: The B.One Middleware is the backend system in which all ZENNER IoT gateways and sensors in the LoRaWAN® network of the Minol ZENNER Connect are stored and managed. In addition, it serves as a kind of “data hub” for your sensors. Their data is received via gateways within range and forwarded to the Gallery, for example, via the Middleware. There they are then graphically processed and clearly visualized using various views and chart types.

Access to the B.One Gallery – with ZENNER IoT PLUG&PLAY

But how do you get access to the B.One Gallery? Basically you need the following:

  1. One access to the LoRaWAN® network EUROPE of the Minol ZENNER Connect
  2. A license to use the B.One Gallery

You get both when you buy a ZENNER IoT GatewayPLUS SMART, GatewayPLUS Indoor or GatewayPLUS Outdoor with the additional option ZENNER IoT PLUG&PLAY for a period of 24 months and up to 50 devices/sensors. After ordering in our online shop, your gateway and/or your sensors are first created in the B.One Middleware and thus made known to the network. Afterwards, if you also ordered it with IoT PLUG&PLAY, your sensors will be stored for you in the B.One Gallery so that you can view their data there. If, on the other hand, you only order a gateway with IoT PLUG&PLAY, you first have to manually set up your sensors in the B.One Gallery. You can also create them directly in the B.One Middleware without having to log into both systems. But important: You have to know your Middleware client and the device key (DevEUI, JoinEUI, AppKey).

You now know what the B.One Gallery is, what you can use it for and how you can get access to it. In the Quick Guide – B.One Gallery we give you a detailed overview of the different areas of the platform and the functions that can be found there. You can also find more tips and assistance for using the B.One Gallery and the B.One Middleware in the respective blog categories:

Do you have any questions or suggestions? Would you like to know how certain use cases can be implemented with the B.One Gallery? Would you like an in-depth article on a specific area or feature of the Gallery? Then please leave us a comment! 😉

Recommend0 recommendationsPublished in B.One Gallery, Operating Aids, Visualization

Related Articles

Responses