Sign in Sign up
Minol ZENNER Connect Logo
  • Sign in
  • Sign up
  • English
    • German

Tag: ZENNER

ZENNER CO2-Indikator und Sensative Strips +Comfort neben einem Schreibtisch im Homeoffice

IoT in Homeoffice & Office: Healthy Room Climate with the Help of LoRaWAN® Part 2 – Connection of an IoT Platform

In part 1 of this small series, we laid the foundations for monitoring the working/room climate in the home office and office with some theory and the…
Community Admin 20. December 2021
ZENNER CO2-Indikator und Sensative Strips +Comfort neben einem Schreibtisch im Homeoffice

IoT in Homeoffice & Office: Healthy Room Climate with the Help of LoRaWAN® Part 1 – Basics & Sensors

A healthy working/room climate is an important factor for high productivity in the home office and office. Find out how you can ensure this using LoRa…
Community Admin 16. December 2021

IoT and Me 2021 – insight into my project – heat protection in summer

– 📖🕓 ≈  3 min – Hello everyone and welcome to my blog post. For everyone who doesn’t know me yet and hasn’t read the blog article “IoT and Me” –…

Cedric 23. June 2021
0 Comments

Insight into my project “IoT and Me” 2021 – refrigerator monitoring

– 📖🕓 ≈  5 min – A warm hello everyone . For those who don’t know me yet and haven’t read the blog post about the participants in the current “IoT…

MiriamOhlenroth 11. June 2021
0 Comments

ZENNER IoT GatewayPLUS SMART – Get started in under 5 Minutes

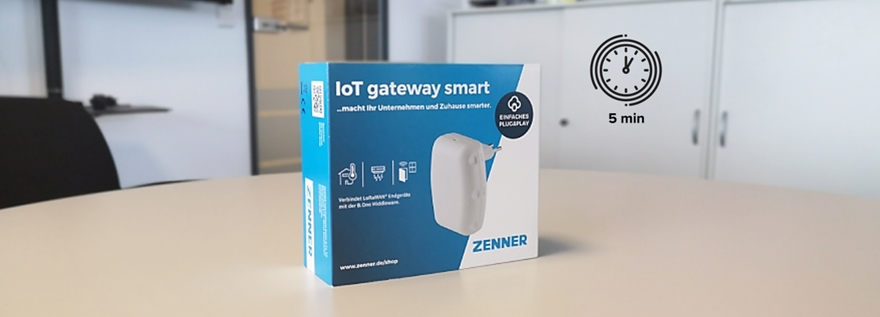
– 📖🕓 ≈  4 min – You have already taken the first important step and the box with your GatewayPLUS SMART is in front of you, but what now? Don’t worry,…

Sven 9. March 2021
0 Comments

Comparative test range of the new ZENNER IoT GatewayPLUS Smart

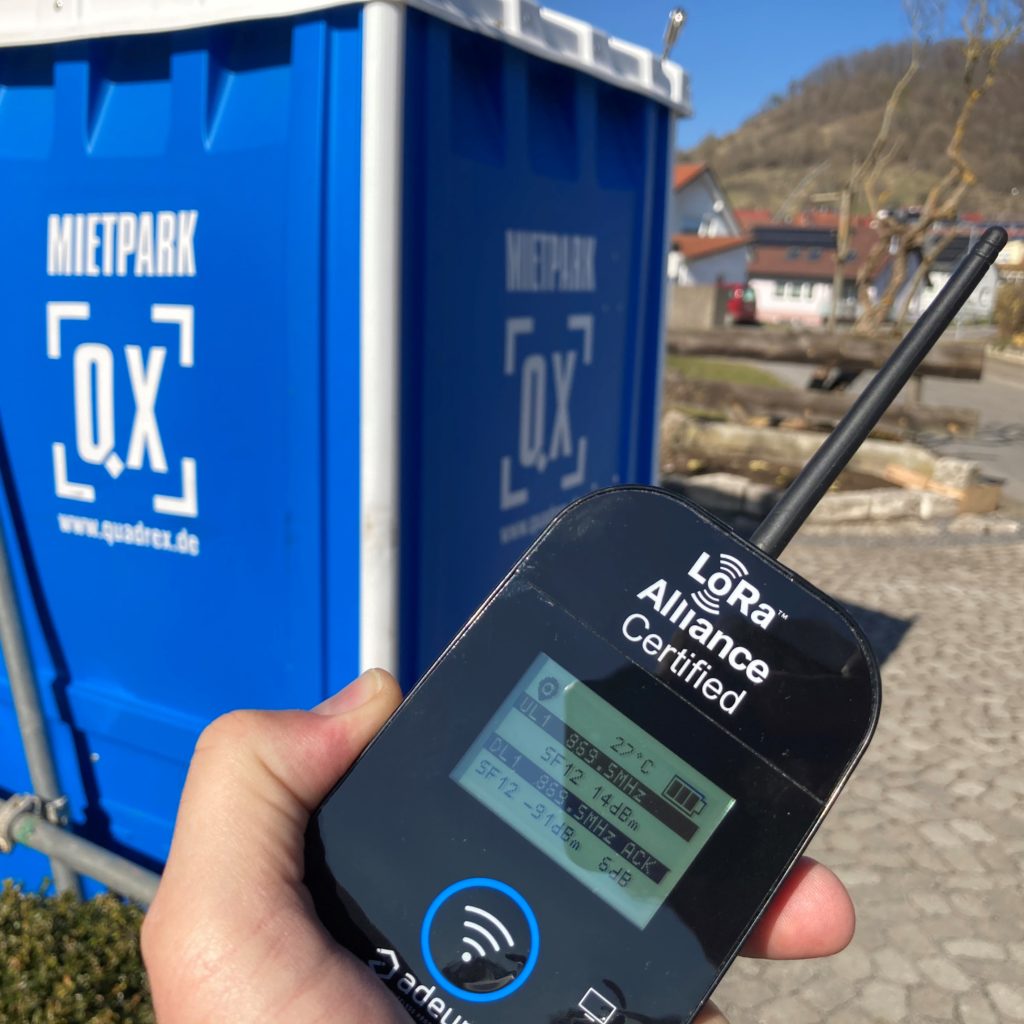
– 📖🕓 ≈  3 min – One of the factors in terms of the reception range of LoRaWAN gateways is of course the installation location. As part of the first tests…

Boris 2. March 2021

Who’s Online

Online 0
There are no users currently online

Search

Categories

Tags

Air quality Alarming B.One Community Brightness CO2 level CO2 measurement CO2 sensor Competition Connectivity door sensor GatewayPLUS GatewayPLUS Indoor GatewayPLUS Outdoor GatewayPLUS Smart Howto indoor climate indoor climate monitoring Instructions IoTandMe IoT platform LoRaWAN LoRaWAN network Minol ZENNER Monitoring Monitoring Network Opening state Open source Payload configuration PLUG&PLAY room temperature sensitive Sensitive strips Sensor technology Strips multi-sensor Strips Multi-Sensor +Drip Temperature Temperature monitoring Tool Trainee contest Visualization tool ZENNER ZENNER CO2 indicator ZENNER IoT GatewayPLUS ZENNER Shop

Recent Posts

  • Room climate dashboard based on B.One Middleware Part 2: Technical Implementation
  • B.One Gallery Howto: Set Up & Manage Notifications
  • B.One Community Howto: Use forums for knowledge exchange
  • Interview zur Kooperation zwischen Hailo Digital Hub & Minol ZENNER Connect
  • Besserer Hochwasser-Schutz mit LoRaWAN® und der KWMSys
© 2023 - B.One Community
  • Privacy Policy
  • Imprint
  • Help
  • Terms of Use

Forum Description

In part 1 of this small series, we laid the foundations for monitoring the working/room climate in the home office and office with some theory and the installation of IoT sensors. Today we complete the whole thing with the connection to the IoT platform B.One Gallery. This includes the initial activation of the devices, the visualization of the data and the setup of notifications .

Connection of the Sensors to the IoT Platform B.One Gallery

After placing the sensors in the room, it's now time to get the data into your IoT platform, where you can view the data visually and set up appropriate notifications for significant status changes. In this case, as already mentioned, we use the B.One Gallery visualization tool. You don't know the tool yet? Then we recommend the article “ B.One Gallery Visualization Tool – An Introduction ”.

Activation of the Sensors

Before your sensors can send data to an IoT platform like the B.One Gallery, they must be initially activated and the so-called “Join process” can be initiated with the LoRaWAN® network . Prerequisite : They have already been created in the systems/platforms used for the network, in this case in the B.One Middleware (used for data transmission/forwarding and gateway administration) and in the B.One Gallery. If you order the sensors with the additional option ZENNER IoT PLUG&PLAY already mentioned in part 1 of this two-part series, this will be done for you automatically and you can start with the activation directly.

ZENNER CO2 Indicator

To start the join process with the ZENNER CO 2 indicator, all you have to do is switch the device on by pressing the on/off button for a long time. After that, the process starts automatically. You can see whether this was successful by the fact that the LoRaWAN® reception bars are permanently displayed at the top left of the display and no longer run from left to right.

ZENNER CO2-Indikator einschalten und aktivieren
Switch on and activate the ZENNER CO2 Indicator

Sensitive Strips +Comfort

With the Sensative Strips sensors, the whole thing works a little differently, as there is no on/off button or similar. Instead, the sensor is in transport/sleep mode when delivered and has to be woken up. To do this, either simply remove the two magnets attached to the sensor or if the join process has not yet taken place automatically, hold the supplied magnet on the rounded side of the strip three times. You can tell whether the join process was successful by the fact that the LED display lights up green for a little longer.

Sensative Strips Multi-Sensor +Comfort aktivieren
Activate Sensative Strips Multi-Sensor +Comfort (using a magnet).

Visualization of the Data

Let's now look at how the data is visualized in the B.One Gallery and how you can be notified of certain status changes or the reaching of certain threshold values.

Visualization in the Dashboard

The dashboard of the B.One Gallery shows you the latest sensor values and thus the prevailing room climate at a glance. For example, if you have grouped the sensors in your office into a separate device group, you can simply select them (instead of all individually). On the other hand, if you use one or more subgroups for these sensors, then simply select the appropriate ones.

Dashboard in B.One Gallery mit aktuellen Werten für Temperatur, Luftfeuchtigkeit, CO2-Gehalt und Helligkeit
B.One Gallery: Dashboard with current values for temperature, humidity, CO2 content and brightness

Visualization in a Report

In addition to viewing the current values in your dashboard, you can also create an individual report so that you can share the data with others via a link if necessary, or access it quickly via a shortcut on your desktop or smartphone. Less relevant in the home office, of course, but very practical in the office on site, for example to make the data available to colleagues without access to the gallery or to pack it on a dashboard that is visible to everyone.

Beispiel-Bericht in der B.One Gallery für Raumklima in Homeoffice oder Büro
B.One Gallery: Example report for indoor climate in homeoffice or office

In the video you can see how we created such a report for this application and added the visualization of the CO2 level as an example:

https://community.mz-connect.com/wp-content/uploads/2021/12/2021-12-15_10-b-one-gallery-bericht-erstellen-raumklima-home-office-co2.mp4

To add the other parameters in the form of the dashboard view or as a diagram, you simply proceed in exactly the same way.

Setting up Notifications

You can easily set up and manage notifications via email or SMS for certain status changes in the B.One Gallery under the menu item of the same name “ Notifications ”. For example, to receive a notification when the CO 2 level rises above 1,000 ppm, simply do the following:

  1. Click on " Add notification " on the left if you have not yet created any notifications. Otherwise you can start directly with 2.).
  2. Select the appropriate device group -> in this example the group "Home Office"
  3. Optionally select a subgroup -> in this example "CO2 level"
  4. Select notification type(s) to see the available sensors -> in this example "CO 2 "
  5. Select the desired sensor -> in this example "ZENNER CO2 indicator ..."
  6. Select the desired notification -> In this example "Notify me if the CO2 level is above or below a certain value"
  7. Specify the condition(s) for the selected notification, including desired thresholds -> In this example, the stored standard value of 1,000 ppm already fits. If you want to define another threshold value, simply create another CO2 notification
  8. Store the recipient (s) of the notification in the appropriate channel ( email or SMS).
B.One Gallery: Benachrichtigung für CO2-Gehalt hinzufügen Schritt 1 - Gerätegruppe & Gerät auswählen
B.One Gallery: Add Notification for CO2 Level Step 1 - Select Device Group & Device
B.One Gallery: Benachrichtigung für CO2-Gehalt hinzufügen Schritt 2 - Gerätegruppe Gerät & Benachrichtigungstyp
B.One Gallery: Add notification for CO2 content Step 2 - Select notification type, device group and device
Benachrichtigung für CO2-Gehalt in der B.One Gallery hinzufügen Schritt 3 - Bedingungen & Empfänger festlegen
B.One Gallery: Add notification for CO2 content Step 3 - Set conditions and recipients

Here's the whole thing again in the video:

https://community.mz-connect.com/wp-content/uploads/2021/12/2021-12-15-b-one-gallery-benachrichtigung-erstellen-co2-gehalt.mp4

This procedure also applies to all further desired notifications for the other parameters.

A notification in your mailbox will then look like this:

Beispiel-Benachrichtigung von der B.One Gallery für einen zu hohen CO2-Gehalt
B.One Gallery: example notification for a too high CO2 level

This sets up a practicable setting for monitoring the working/room climate in the office and home office. So nothing stands in the way of high productivity of course, the whole thing can then be flexibly supplemented with additional sensors, for example to monitor parameters such as the noise level.

As always, questions, suggestions, feedback or shared experiences are welcome in the comments!

And other helpful articles about the B.One Gallery can be found in the blog category of the same name.

COOKIES:

In order to provide you with the best possible user experience and offer, we use cookies on our website that are not only technically necessary but also serve to analyse access. By clicking on 'Accept all' you agree to this. You can find more detailed information and how to revoke your consent at any time in our Privacy Policy. (Decline)
Cookie settingsAccept all
Einwilligung erneut aufrufen

Your Cookie Consent

Our website uses cookies to help us improve our website and provide you with the best possible service. These cookies are necessary and cannot be disabled. We also use cookies to analyse the traffic on our website. By clicking on 'Accept', you agree to our cookie policy:
Essential
Always Enabled
Essential cookies enable basic functions and are necessary for the proper functionality of the website.
Statistics
Statistics cookies collect information anonymously. This information helps us understand how our visitors use our website.
SAVE & ACCEPT