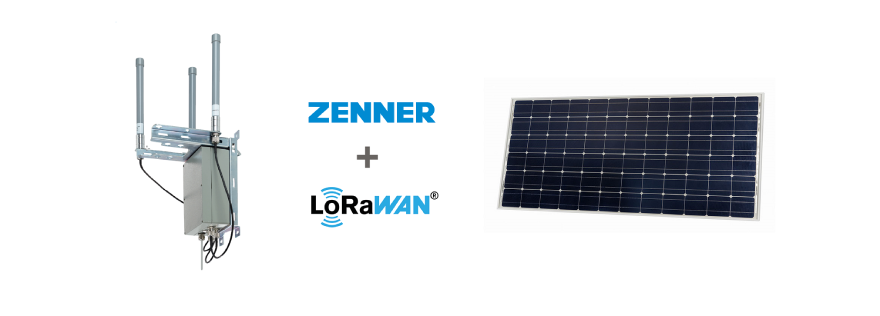
The ZENNER IoT Gateway Outdoor becomes a self-sufficient photovoltaic (PV) gateway. After presenting the first prototypes and the findings from the Po…
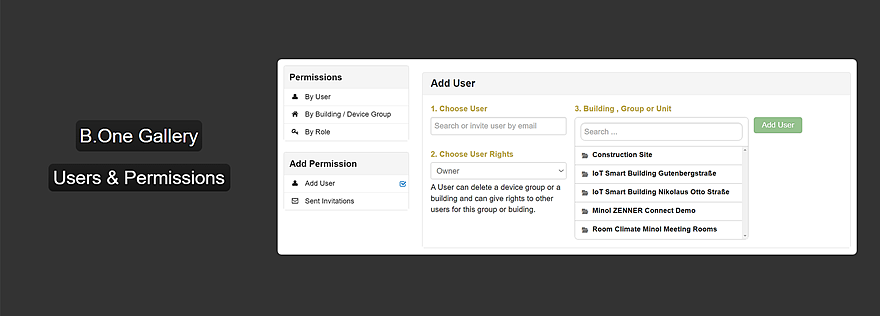
In the user management of the B.One Gallery, you can specify which other users should have access to which of your device groups and thus to your sens…
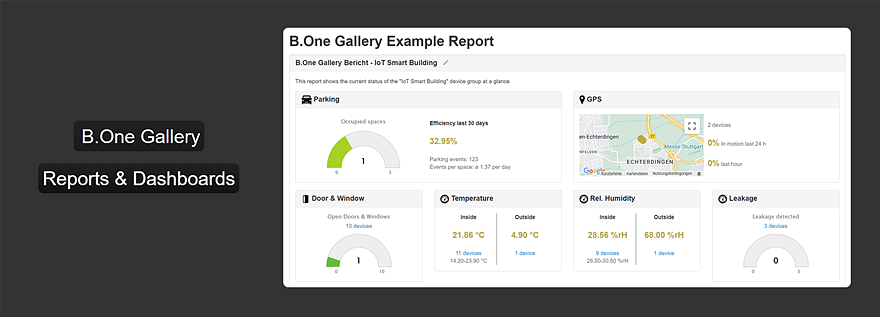
The B.One Gallery offers you the opportunity to create customized graphical reports and dashboards from your sensor data and to share them with others…
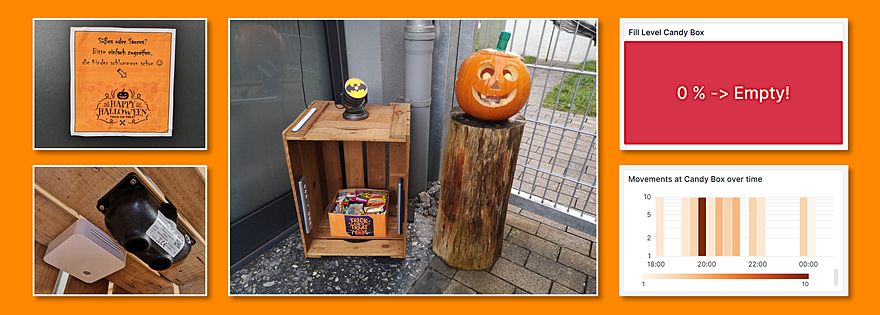
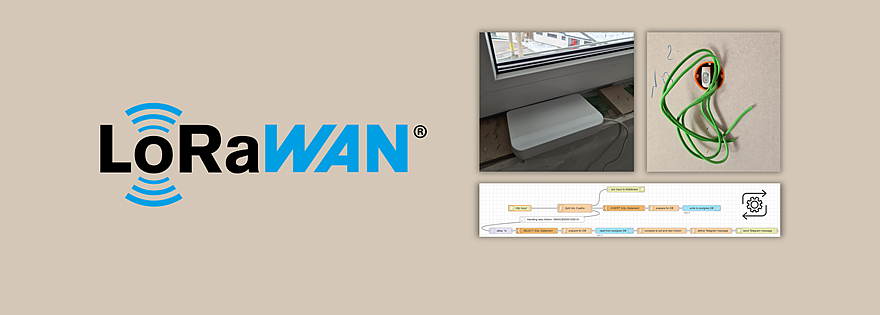
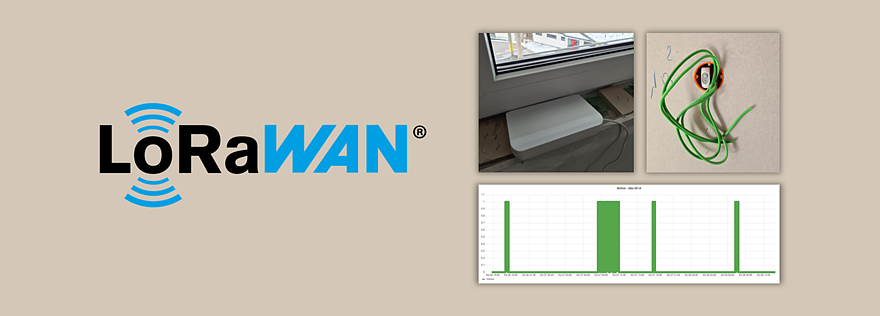
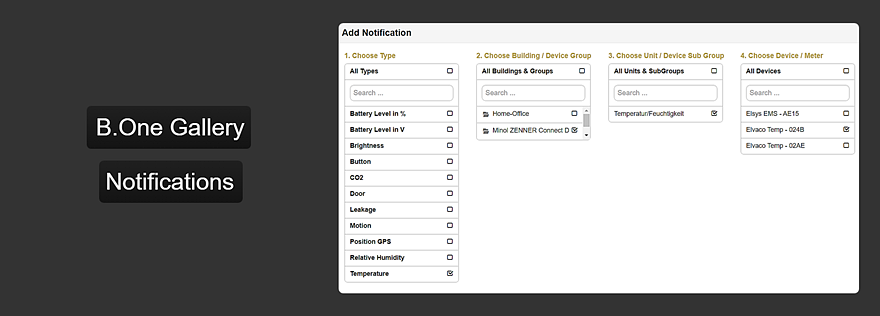
The B.One Gallery offers the option of setting up notifications for critical status changes in order to be informed immediately. We show you how easy …
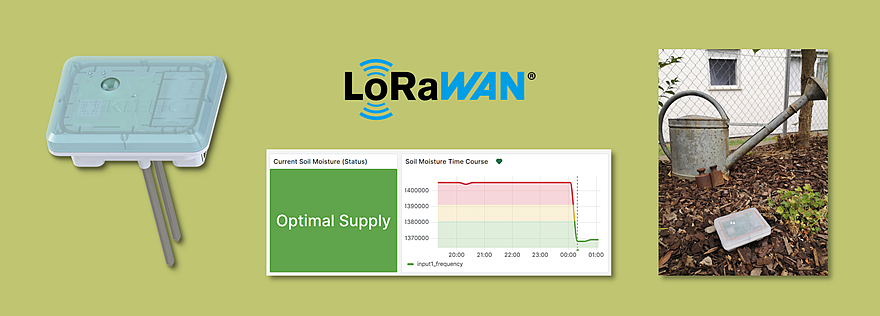
Are you also always unsure whether or when your plants will need water again and how much? Or do you have to ensure a certain indoor climate for them,…
In order to provide you with the best possible user experience and offer, we use cookies on our website that are not only technically necessary but also serve to analyse access. By clicking on 'Accept all' you agree to this. You can find more detailed information and how to revoke your consent at any time in our Privacy Policy. (Decline)
Our website uses cookies to help us improve our website and provide you with the best possible service. These cookies are necessary and cannot be disabled. We also use cookies to analyse the traffic on our website. By clicking on 'Accept', you agree to our cookie policy: