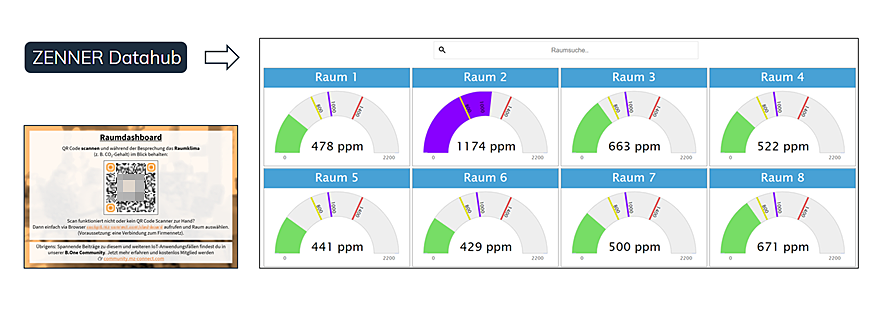
In the first part of this small series, we showed you an implementation example for a room dashboard based on the ZENNER Datahub. Now let's take a clo…
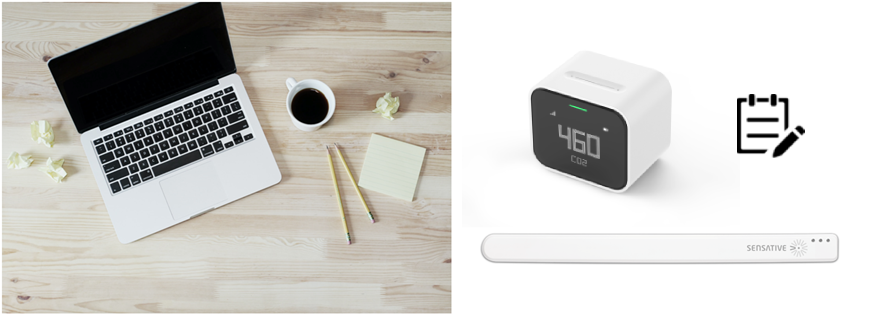
Most recently, it was shown here how you can ensure a healthy indoor climate with IoT sensors and the B.One Gallery, for example in the home office or…
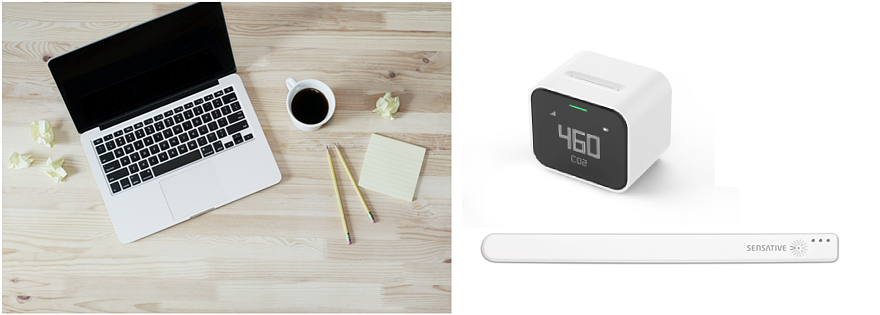
Most recently, it was shown here how you can ensure a healthy indoor climate with IoT sensors and the B.One Gallery, for example in the home office or…
In part 1 of this small series, we laid the foundations for monitoring the working/room climate in the home office and office with some theory and the…
A healthy working/room climate is an important factor for high productivity in the home office and office. Find out how you can ensure this using LoRa…
In order to provide you with the best possible user experience and offer, we use cookies on our website that are not only technically necessary but also serve to analyse access. By clicking on 'Accept all' you agree to this. You can find more detailed information and how to revoke your consent at any time in our Privacy Policy. (Decline)
Our website uses cookies to help us improve our website and provide you with the best possible service. These cookies are necessary and cannot be disabled. We also use cookies to analyse the traffic on our website. By clicking on 'Accept', you agree to our cookie policy: