ZENNER IoT Gateway Outdoor becomes PV Gateway Part 3: Final Setup & Monitoring
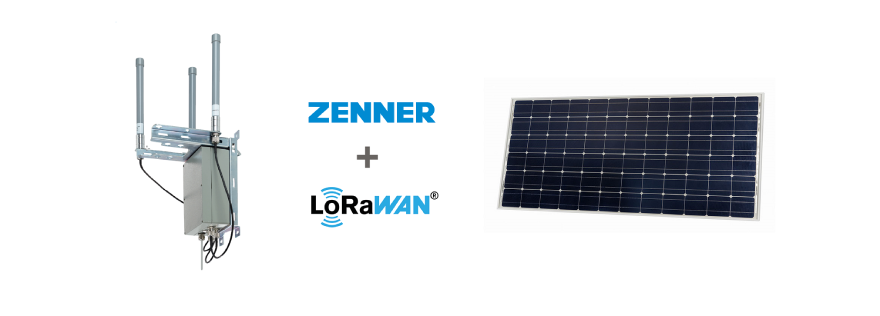
The ZENNER IoT Gateway Outdoor becomes a self-sufficient photovoltaic (PV) gateway. After presenting the first prototypes and the findings from the Po…

– 📖🕓 ≈ 6 min – Last modified on 10th April, 2024 In my last two articles I have already shown you how you can connect the ZENNER Datahub to the…

– 📖🕓 ≈ 5 min – Last modified on 10th April, 2024 In my last article I already showed you how you can connect the ZENNER Datahub to the IoT platform…

– 📖🕓 ≈ 6 min – Last modified on 10th April, 2024 As you may already know, the versatile ZENNER Datahub can be flexibly connected to various IoT systems. In the…
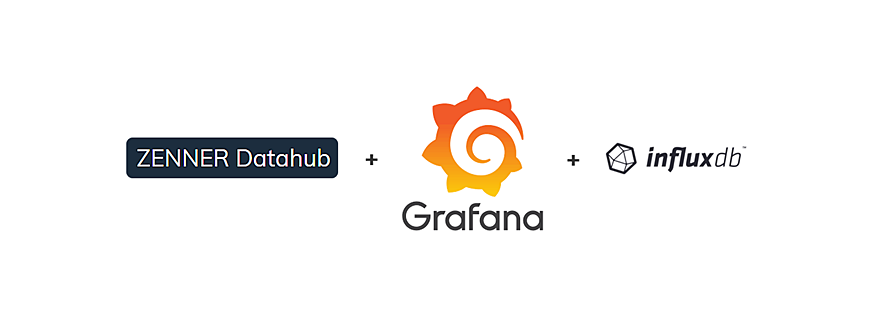
– 📖🕓 ≈ 5 min – Last modified on 10th April, 2024 In the last articles you have already been given a small introduction to the open source tool Grafana. It…
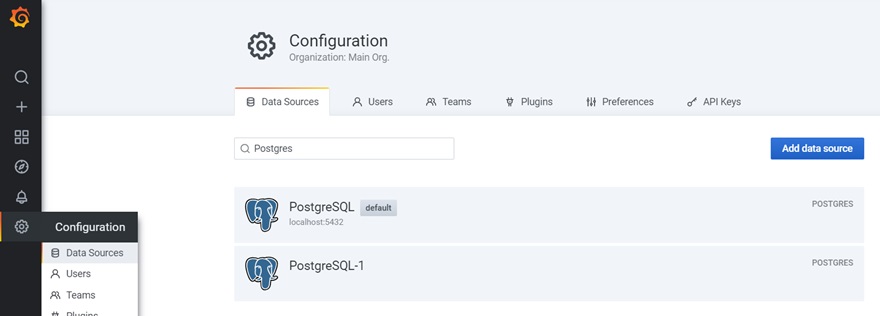
– 📖🕓 ≈ 3 min – We introduced and described Grafana in the previous articles “Open Source Tool Grafana – An Introduction” and “Grafana Howto: Local Installation & Setup Using Ubuntu…

– 📖🕓 ≈ 4 min – The article “Open Source Tool Grafana – An Introduction” has already described what kind of tool it is and what you can basically do with…

– 📖🕓 ≈ 4 min – Last modified on 11th April, 2024 In the digital age, the monitoring and display of systems and databases, both in private and in business, are…