Indoor Climate Dashboard based on the ZENNER Datahub Part 2: Technical Implementation
In the first part of this small series, we showed you an implementation example for a room dashboard based on the ZENNER Datahub. Now let's take a clo…
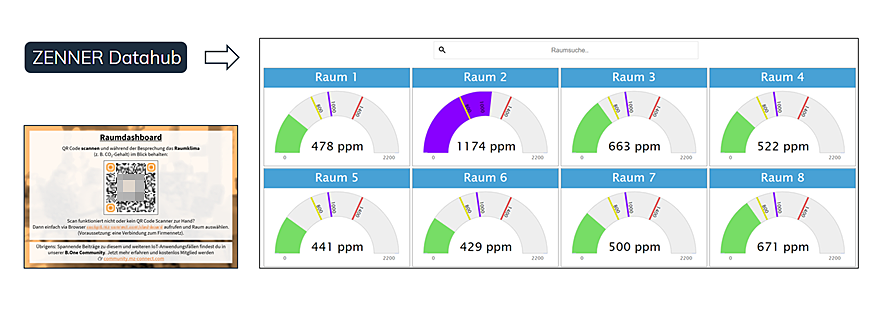

– 📖🕓 ≈ < 1 min – Last modified on April 2nd, 2024 Ideal for monitoring rooms, meeting rooms, offices, classrooms, warehouses, rooms, production areas, cold rooms, greenhouses, technical rooms. But also,…