Indoor Climate Dashboard based on the ZENNER Datahub Part 1: An Implementation Example
Last modified on 15th April, 2024
The use of LoRaWAN® sensors in combination with a dashboard is ideal for monitoring the indoor climate in meeting rooms. That’s why we’re presenting a small series of articles that show you what a self-programmed indoor climate dashboard tailored to individual requirements based on the ZENNER Datahub IoT platform can look like. In this first part, we will go into the advantages of a dashboard, which IoT sensors we use in this case and what exactly our example dashboard looks like. In the second part we go into more detail about the technical implementation. Here we will also show you exactly how the data from the ZENNER Datahub is extracted and processed. If you are only interested in a specific aspect, simply click on it in the list below to go directly to the relevant section:
Are you still wondering why a healthy indoor climate is actually so important and which factors/parameters play a central role here? Then take a look at Michael‘s blog article “IoT in home office & office: Healthy indoor climate with the help of homeoffice Part 1 – Basics & sensors“. Otherwise, in a nutshell: A healthy room climate ensures increased well-being, an increased ability to concentrate, prevention of tiredness, a lower risk of infection/contagion from COVID-19 (Coronavirus SARS-CoV-2) and ultimately higher productivity and cost savings in the company.
The Benefits of a Dashboard
For all of you who may be wondering why a dashboard is actually needed at all: one simply offers a number of advantages, the following in particular being worth mentioning:
- Measured values from sensors that do not have an integrated display are visible to everyone in the room, regardless of their seating position or viewing direction
- Measured values can also be called up remotely and can therefore be viewed, for example, even before a room is booked and/or before the start of a meeting
- Greater individual design freedom with regard to the parameters to be displayed and the graphic representation, such as:
- Measured values can also be recorded and displayed over time. This in turn makes it possible to evaluate the data afterwards in order to derive certain conclusions or specific recommendations for action for the monitored rooms
- Display of the current measured values can be supplemented with freely selectable text, which makes interpretation or classification easier. Example: you don’t have to first deal with the different value ranges in order to assess whether the air quality is good or bad and when you should ventilate at the latest
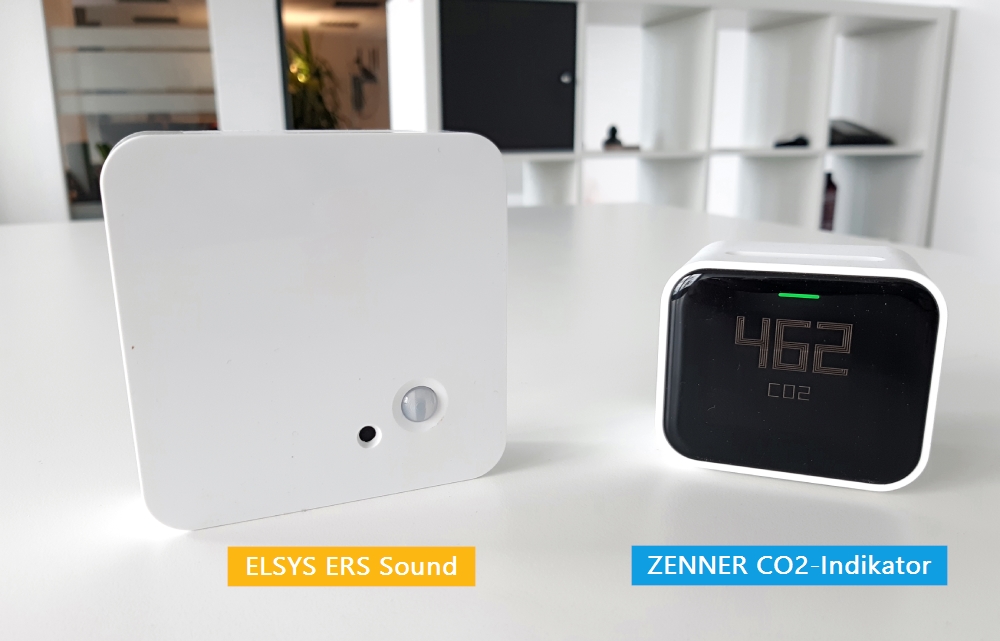
The IoT Sensors used
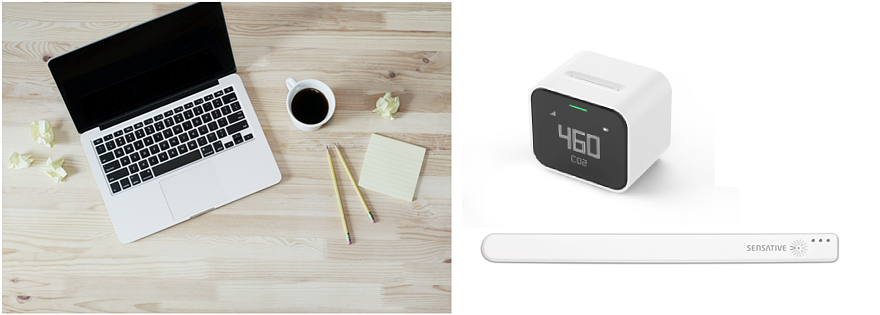
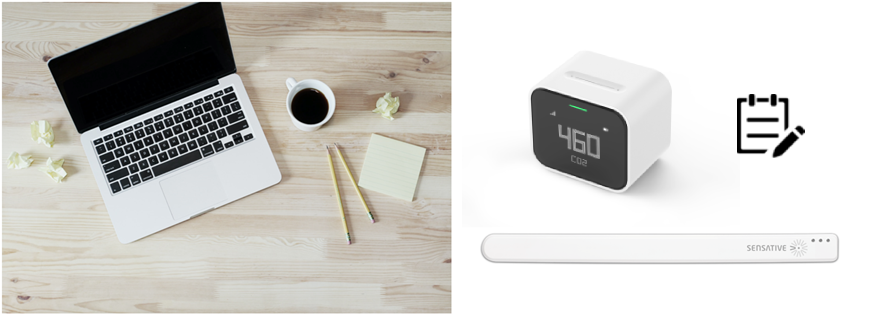
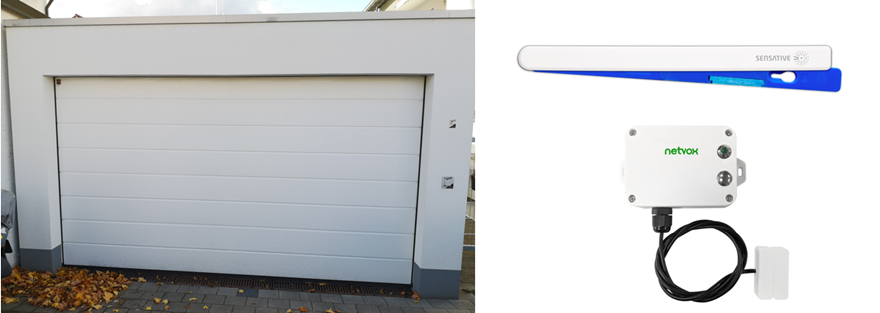
For our example dashboard, we have equipped the meeting rooms to be monitored with the ZENNER CO2 indicator and in some cases also with the ELSYS ERS Sound. On the one hand, this monitors the CO2 level, i.e. the current air quality, and on the other hand the noise level. Both sensors are based on LoRaWAN®, although the former also works without it, provided no forwarding to a dashboard for visualization is required. In our case, however, the data collected by the sensors is sent to the ZENNER Datahub IoT platform via LoRaWAN® gateways within range, from where it is then forwarded to the dashboard. How exactly this works is shown in the second part of this series of articles.
Example Dashboard for Indoor Climate Monitoring
Now let’s move on to the actual dashboard. But before we show how exactly the measured values are displayed there and what they actually are, a few words on the basic implementation.
Access via QR Code instead of Fixed Installation
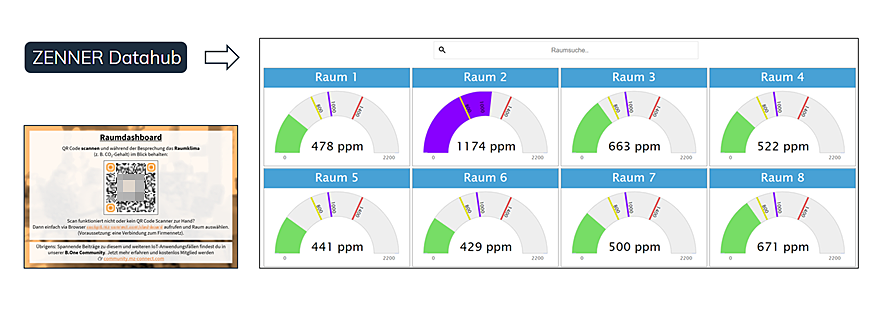
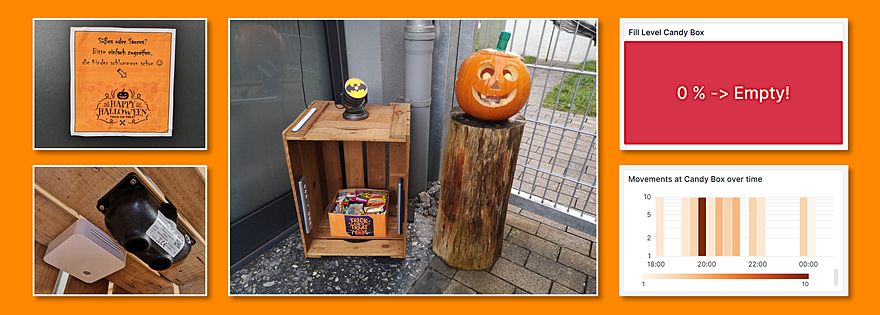
When implementing our sample dashboard, we decided to make it accessible for the individual meeting rooms via a simple QR code. This means that it can be used on any device and does not require a fixed installation. Below you can see an example of such a QR code located in the rooms:
Individual room views and overall overview
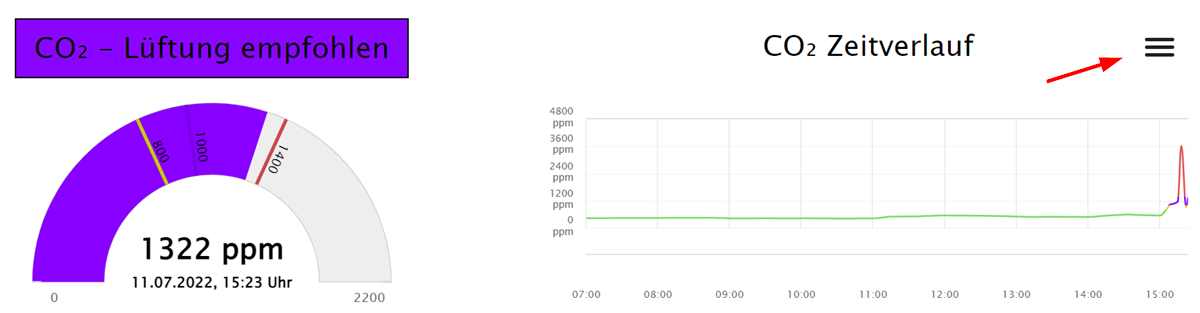
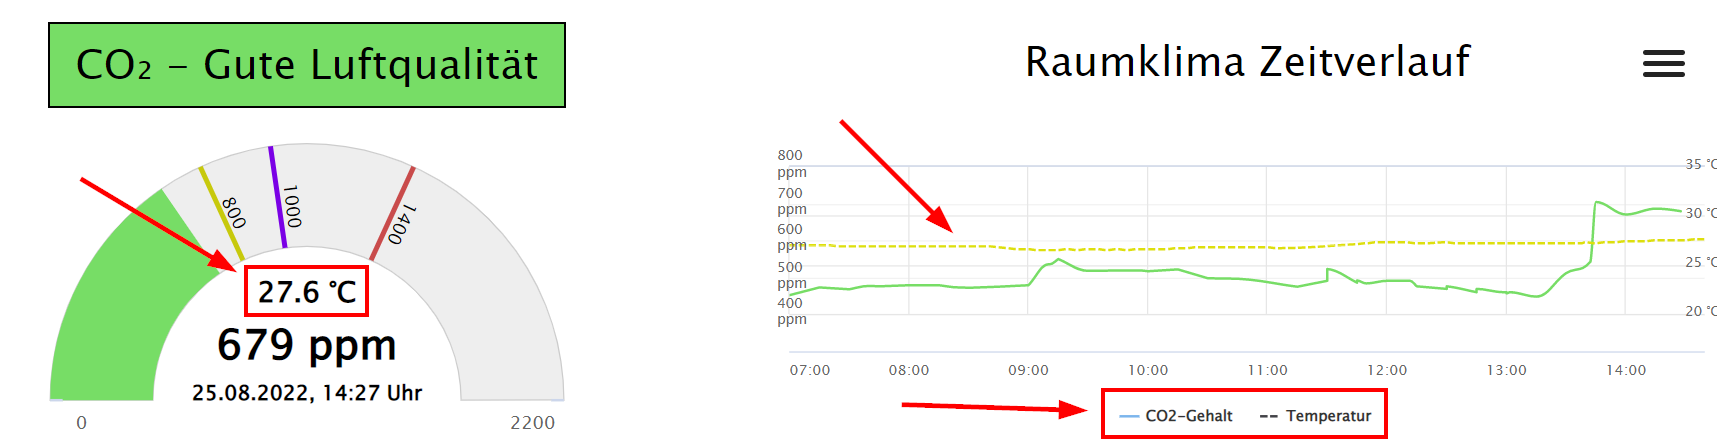
After scanning, you land directly on the individual view of the corresponding room and you can make it visible to all meeting participants on the laptop or, if available, on a TV monitor on the wall. By default, a gauge with the current CO2 value (in ppm = parts per million) or noise level (in dB = decibels) and the respective time progression for the current day are always displayed here. The threshold values can also be seen on the gauge, from when the display changes accordingly. This in turn shows the current status of the air quality or the noise level and indicates whether the room should be ventilated or the volume should be reduced.
Here is an example of a room with a CO2 level of over 1,399 ppm:
If necessary, this view can also be easily adjusted using the menu at the top right, as can be seen in the next screenshot and screencast. For example, the time courses can simply be hidden if they are not required.
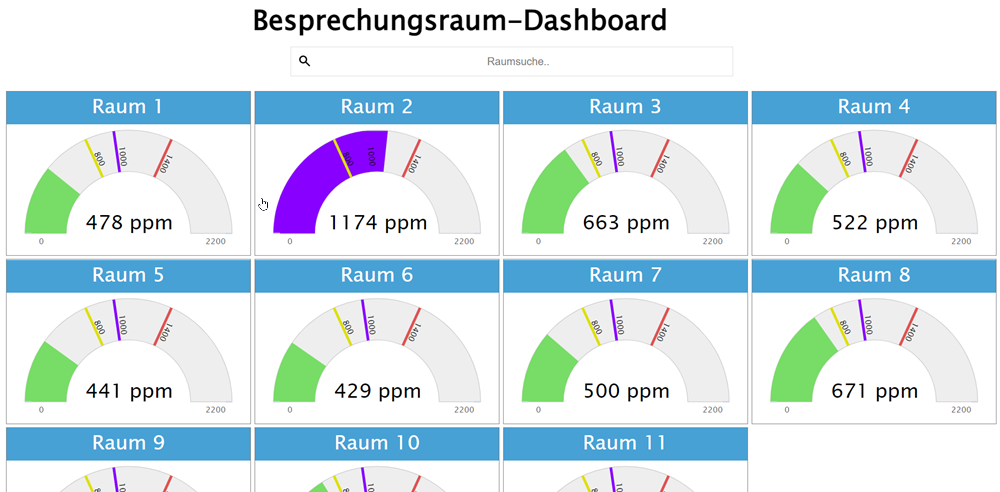
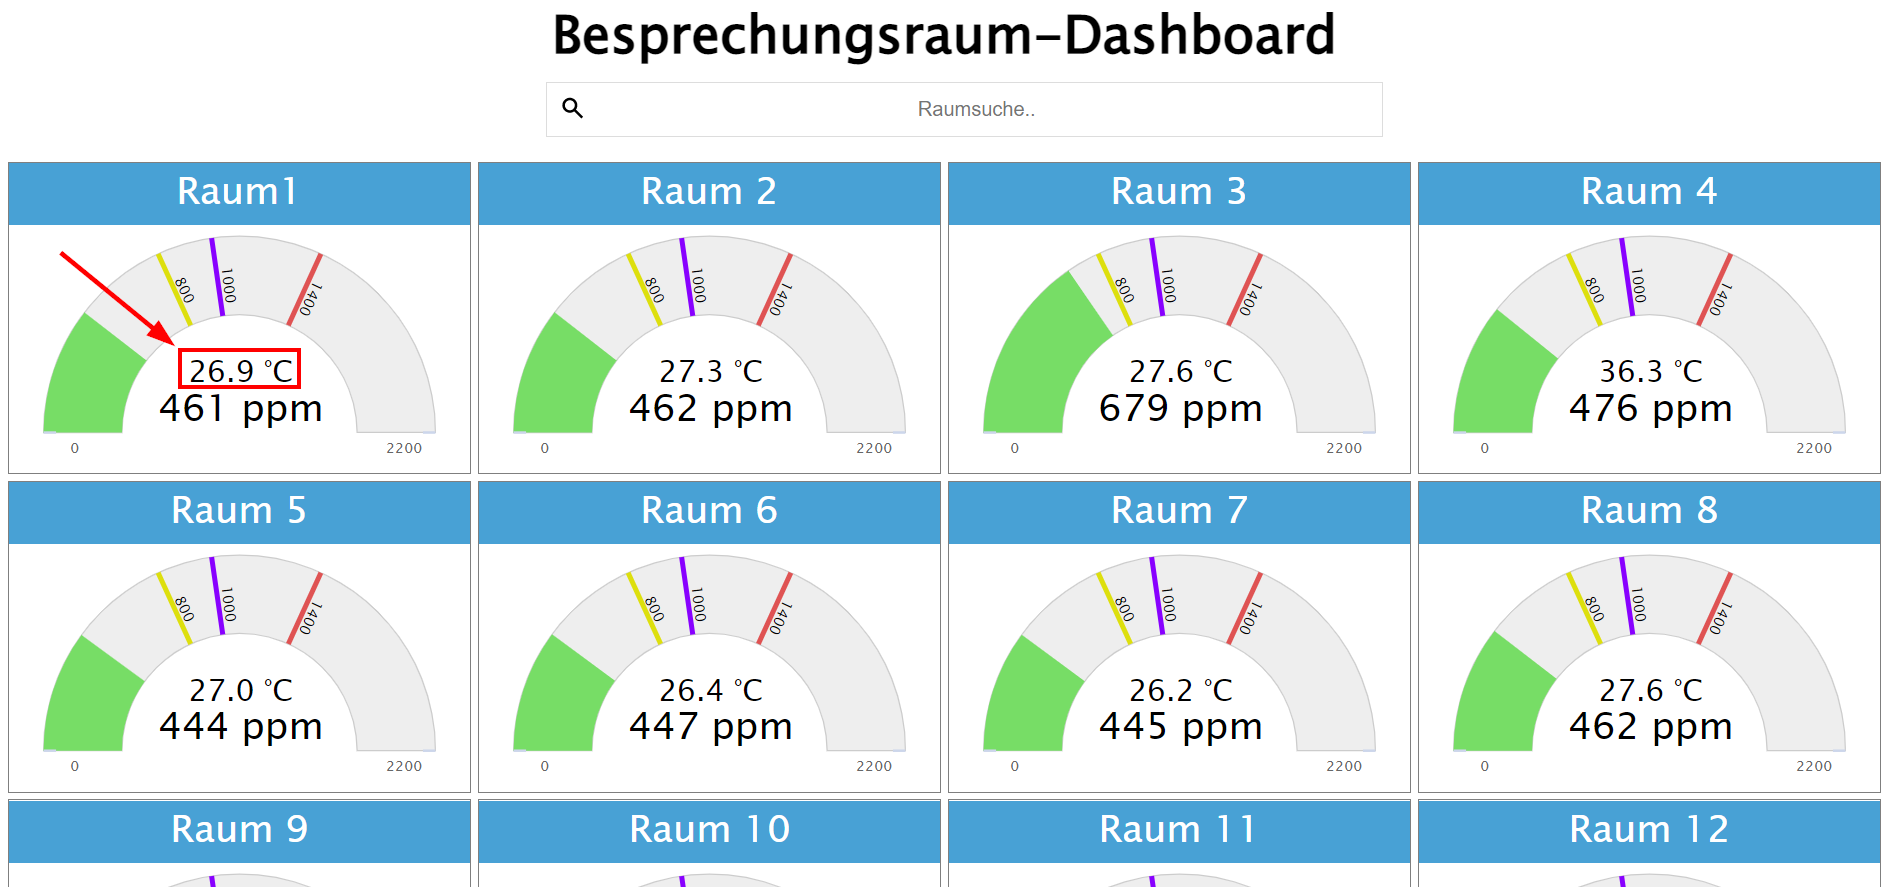
In addition to calling up the individual room views via the QR code, you can alternatively call up a complete overview of all available meeting rooms via a corresponding URL. On this you can see all rooms equipped with sensors together with the current CO2 level at a glance and you can select the required room to also get to the respective detailed view. For data protection reasons, however, an existing connection to the company network is required. The practical thing about this overview, in addition to the function as a fallback, if the QR code scan doesn’t work or you don’t have a scanner at hand: A picture of the current CO2 level can be taken before a meeting, for example to air a few minutes before if necessary.
Displayed Measured Values & Value Ranges
As already described, the dashboard only contains the two parameters CO2 level for air quality and noise level, true to the motto less is more.
In case you are still wondering which threshold values values are stored for the CO2 concentration:
- < 800 ppm → normal = Good air quality
- 800 – 999 ppm → slightly increased = Medium air quality
- 000 – 1,399 ppm → high = Poor air quality / Ventilation recommended
- > 1,399 ppm → very high = Very poor air quality / Ventilation strongly recommended
And as far as the noise level is concerned, the whole thing looks like this:
- < 56 dB → quiet/silent
- 56 – 65 dB → increased
- > 65 dB → loud
Part 2: Technical implementation
You have now seen what an example dashboard for room climate monitoring based on the ZENNER Datahub can look like. Of course, this can now be supplemented with other relevant parameters such as temperature, humidity or illuminance/amount of light. In this case, no additional sensor would be required, since the ELSYS ER Sound can also record these parameters in addition to the noise level. There are basically no limits to your own creativity when expanding and designing the dashboard, depending on how much time and effort you want and can put into it. As mentioned at the beginning, in the second part of this mini-series we look at the technical implementation of our indoor climate dashboard. Here we will tell you which technology or programming language our example dashboard is based on and show you how the data from the ZENNER Datahub is extracted and processed.
PS: We look forward to a lively exchange with you on this topic. What do you think of the approach chosen here with the QR Code? Does your company have indoor climate monitoring for meeting rooms and if so, how was the whole thing implemented there? Leave us a comment 🙂
Update [25 .08.2022]
Extension with Parameter Temperature
After only the parameters CO2 level and noise level were displayed on our sample dashboard as described above, we have now expanded it to include the temperature parameter.
For the overall overview, this means that the current room temperature is now also displayed in addition to the current CO2 level. In this way, before a meeting or a room booking, you can see directly which meeting room is currently the warmest or coldest.
As far as the views of the respective rooms themselves are concerned, the temperature value can now also be seen in the gauge on the left above the CO2 value. In addition, you can see the temperature development over time for the current day in the diagram on the right-hand side. If required, the CO2 level and temperature in the time course diagram can be shown or hidden using the legend below.
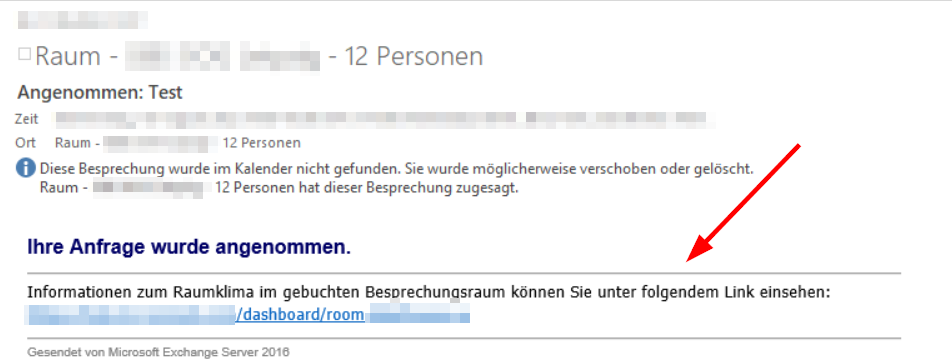
Dashboard Link in Outlook Booking Confirmation
In addition to the extension of the temperature, we have implemented another thing that we consider very practical as a test. If someone books one of the meeting rooms equipped with the IoT sensors via Outlook, the organizer receives a confirmation email if the booking was successful. This email now contains the direct link to the respective room view. In this way, the organizer can quickly check the current situation before a meeting without first calling up the room overview and, if necessary, go into the room a little earlier, for example to air it out.

Responses