Quick Guide – B.One Gallery
1. Access Data & Log-In
In order to be able to log into the B.One Gallery, you first need a corresponding account. We’ll take the first step for you. After the first order of a GatewayPLUS SMART, Indoor or Outdoor (as well as optionally suitable sensors) with the additional option ZENNER IoT PLUG&PLAY in our shop, a new user will be created for you in the gallery with your email address. If you have also ordered corresponding sensors with the same option, then these will also be created there for you. You will then receive an invitation via email to activate your account and to generate a profile name of your choice and your own password. You can then use this data to log in to the B.One Gallery immediately after successful activation. If you do not find a corresponding email in your inbox, please also take a look in your spam folder. And since the platform is browser-based, it can be displayed on all common browsers without installation, updates, drivers, etc.

Tip: if you want to prevent yourself from being automatically logged out after a certain period of inactivity for technical reasons, then check the box “Check to remember me on this computer.” below.
2. Menu Structure/Navigation
In the desktop view, you have quick access to all important areas of the B.One Gallery via the horizontal navigation menu at the top of the header area: Buildings & Groups, Reports & Dashboards, Users, Notifications, Help Manual, Contact, Languages and Profile. On mobile devices you will find this in the horizontal navigation in the so-called burger menu . For the sake of simplicity, however, the descriptions below always refer to the desktop view.

3. Profile & Languages
First we will go into the two areas “Profile” & “Languages”.
The currently selected language is displayed at the top right next to your profile name, which is German by default. By opening the dropdown, you can also switch to English, Danish or French if required.

As just described, you will find the “Profile” right next to the language selection.

Here you can manage your personal data, upload a profile picture or alternatively select an avatar. You can also invite friends or colleagues to work with you in your B.One Gallery account or change your current password.

4. Buildings & Groups
One of the most important areas of the B.One Gallery is called “Buildings & Groups“. Here you can see all your devices/sensors linked to the Gallery and the data they have transmitted, and you can manage them.

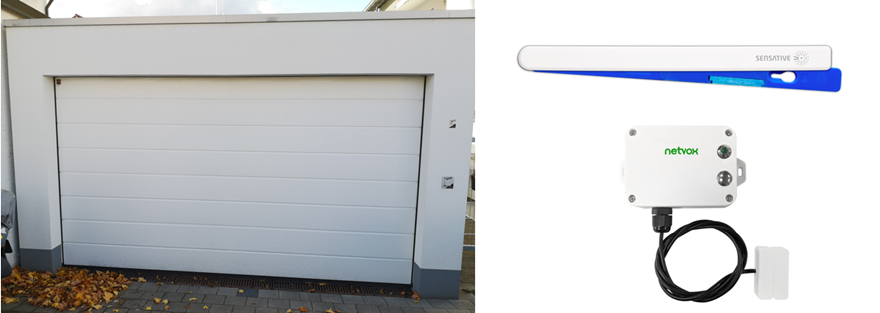
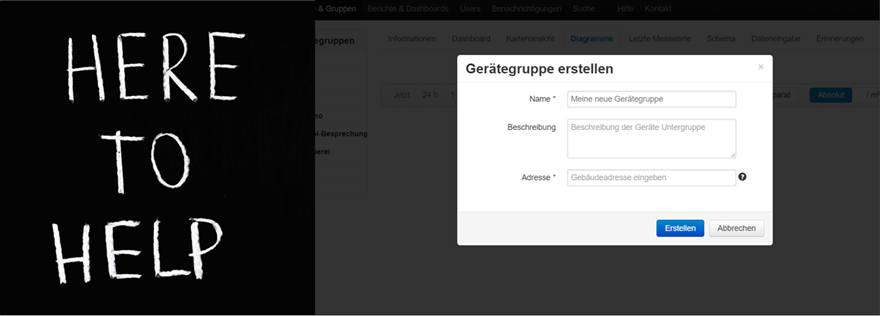
If you bought a GatewayPLUS and sensors with the ZENNER IoT PLUG&PLAY option in our shop, then these are already visible to you after the first log-in in a so-called “device group” on the left (see also the blog article “B. One Gallery Howto: Create sensors“). If, on the other hand, you have only purchased a GatewayPLUS and are already using your own sensors that are to be displayed in the gallery, you must first create a new device group yourself and then add your sensors there manually. You can see whether your sensors are compatible with the Gallery when adding a device in the corresponding selection list under “Device type”.

In order to view the data from your sensors, you must then select at least one device group including the desired sensors in the overview on the left. By clicking on such a group, it can also be expanded further so that you can see the subgroups and sensors below it. The actual selection is then made by ticking the desired group and the desired sensors. If you are looking for a specific sensor or a specific device group, you can also use the practical search, which you can find directly above the list of your sensors and groups.
Depending on which tab you then navigate to on the right-hand side, different data and views are then available to you.
“Information” Tab
Under “Information” you will find the “meta” information you have manually stored in a device group and various automatically generated key figures. For example, the number of devices, the number of subgroups created, a unique identification key, the date since when the group has been linked to the Gallery and, if available, the stored address.

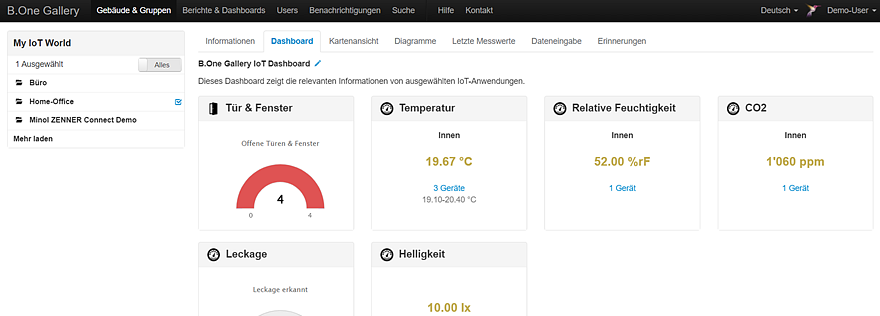
“Dashboard” Tab
In the “Dashboard” tab you will find the most concise information about your device groups and sensors selected on the left, presented in compact form for a quick overview. Here you can always see the latest values, whereby you can select individual sensors or even individual measured values of certain sensors in addition to entire device groups. The dashboard is then filled automatically depending on this selection. i.e. For example, if you are using a GPS tracker and select it, a corresponding map view with the last recorded position will automatically appear on the dashboard.

Tip: if you are surprised about the values displayed here, this could be because the current average value of all selected sensors is formed in the case of multiple selection.
“Map View” Tab
In the “Map view” you will find, if you use sensors that transmit your position, a map with the last recorded position and the last recorded values. It is important to know that only those position values are transmitted to the B.One Gallery for which there is or was a GPS fix. Depending on the GPS reception, the position shown on the map may differ slightly from the actual position.

“Charts” Tab
The “Charts” tab contains a visual representation of the data from your sensors selected on the left in the selected time period. Various types of charts (line, bar, pie charts or alternatively tables) help you to interpret and evaluate your data and to derive suitable conclusions or actions. Depending on the sensors used, you can switch to different sub-tabs here. In the following example, charts are available for the media types Light, Air & Climate, Motions, Buttons, Battery, Door & Window, Position and Leakage. A special feature are the so-called Combo charts, in which different media types can be displayed in a single chart. Also useful: for all charts, you can choose between a combined and separate value display in the case of multiple selection. However, due to the large number of chart types, there will be a separate article in which we will go into this area in more detail.

“Last Measurements” Tab
The last measurement values are always displayed under “Last measured values”. So you can see how up-to-date the values displayed in the other views are and when your devices last sent.

“Data Input” Tab
The “Data Input” tab only appears after selecting a device group and offers you the option to add manual counters to it. This means meters (e.g. water meters or heat meters) that are not read conveniently by radio, but rather by hand.

“Reminders” Tab
The “Reminders” function is only available for device groups in which you have stored manual counters via data input (see above). It serves to remind you of the meter reading.

5. Reports & Dashboards
Under “Reports & Dashboards” you can create and manage customized reports on the data of your device groups. You can then share this with anyone who needs access to it (B.One Gallery users or other external people). Both individual charts and entire dashboards can be added to a report.
If you have already created reports, they are listed on the left. You can create a new report either via the gear icon to the left of “Reports & Dashboards” or, if you have not yet created any reports, via the blue “Create Report” button.

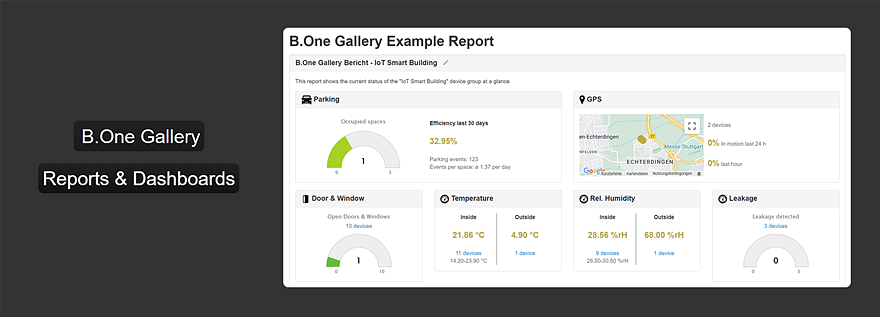
After creating a report, you still have to select the dashboards and/or charts that should be displayed in the report. To do this, you first navigate to the corresponding device group. If you then want to assign a dashboard to the report, simply go to “Generate standalone link for this dashboard” at the bottom of the respective dashboard and assign it to your desired report. For charts, simply right-click the chart and click Generate Public Link.


Here is an example report consisting of dashboard and charts:

6. Users
Under “Users” you can manage the users stored in your account and their permissions for all device groups or invite new ones that you own. The permissions for the users are in turn defined via the assigned roles.


Tip : in the view under Users you can “only” see the device groups for which you are also stored as the owner. If you want to see what your current role is with others, go back to “Buildings & Groups” and then click on the gear icon for the respective group. In the menu that now opens, you can see your current role at the top.

7 Notifications
In the “Notifications” tab you can set up and manage notifications for certain status changes of your sensors (alarm) notifications for different channels (e.g. email or SMS). Depending on which sensors you have integrated, different notification types are available to you.

On the left side you will also find the option to switch between different views. You can display your existing notifications sorted by device group, notification type or current status. Below you can quickly and easily add a new notification. Also practical: notifications that have been created can be activated (On) and deactivated (Off) as you wish.


You can see exactly how you can set up a new notification with an example in the “B.One Gallery Howto: Setting up geofencing” or in the “B.One Gallery Howto: Setting up and managing notifications”. More examples will follow.
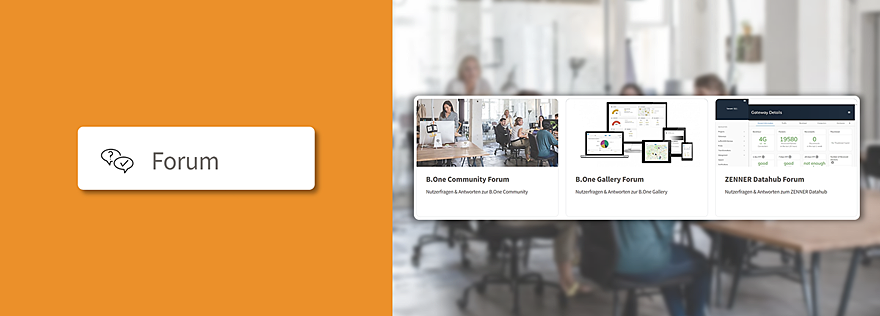
8. Help Manual & Contact
In addition to the notifications, you will find the two areas “Help Manual” and “Contact”. Under Help Manual you will find small help articles on different functions/areas of the B.One Gallery. Since this integrated help manual area is currently still very clear, it is already being expanded so that you will find much more extensive help here in the future.

If you don’t get the answer to your question(s) here, simply send us a message via the contact form under “Contact“, which we will answer as soon as possible.

Responses