LoRaWAN® on the Construction Site: Use Cases, Advantages & Practical Example
Last modified on 11th April, 2024
One of our members is currently building his own home and is using LoRaWAN® on his construction site to solve several problems. On this occasion, we show you in a small series of articles a few possible IoT use cases on your own construction site, why LoRaWAN® is the transmission standard of choice there and how you can implement the whole thing in practice using a specific use case.
IoT Use Cases on the Construction Site
First, some ideas for use cases that we think make sense and that can be easily implemented on construction sites using IoT sensors and LoRaWAN®:
- Monitoring the presence/activity of craftsmen
- Monitoring the room climate to avoid/prevent mold or to check the drying of the screed
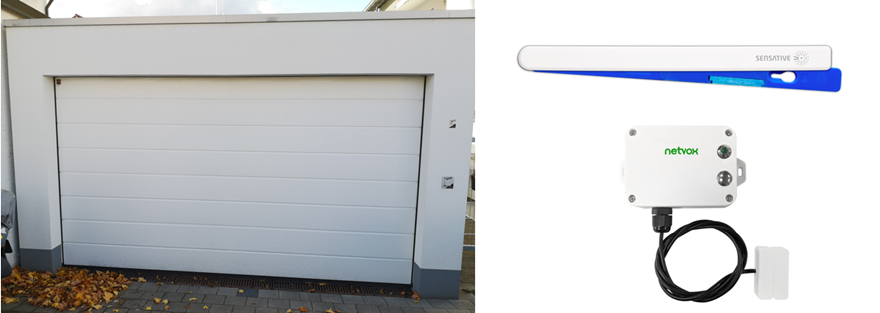
- Detection of leakages at vulnerable points
- GPS monitoring of machines, IBC tanks for storing liquids such as oil, tools or other valuables
- Lighting control to avoid unnecessary power consumption
- Level monitoring of IBC or other tanks
As you can see, there are a number of possible use cases here. Of course, this is not an exhaustive list and there are certainly many more. After all, there are no limits to your own creativity.
Advantages of LoRaWAN® on the Construction Site
Why is LoRaWAN® a suitable transmission standard for the construction site or what are its most important advantages there? From our point of view, the main ones are:
- The realization of large coverage ranges with few means (depending on the respective local conditions usually up to 5 km in urban areas, even up to 20 km in rural areas)
- The excellent building penetration and the very high interference immunity
- The very low power/energy consumption of LoRaWAN®-based, battery-operated IoT sensors = low-maintenance, durable, cost-effective and ideal for hard-to-reach measurement points/locations
If you want to learn more about LoRaWAN® and its other benefits, including how it compares to other standards, then take a look at our FAQ in the help area and our blog post “LoRaWAN® vs. NB-IoT – A first overview and comparison“.
Practical Example of Presence Monitoring – A Basic Setup
Using the specific application of the presence monitoring mentioned above, we will now show you how you can implement the whole thing in practice based on the ZENNER Datahub and what you need for it.
1. IoT Sensors for Presence Detection
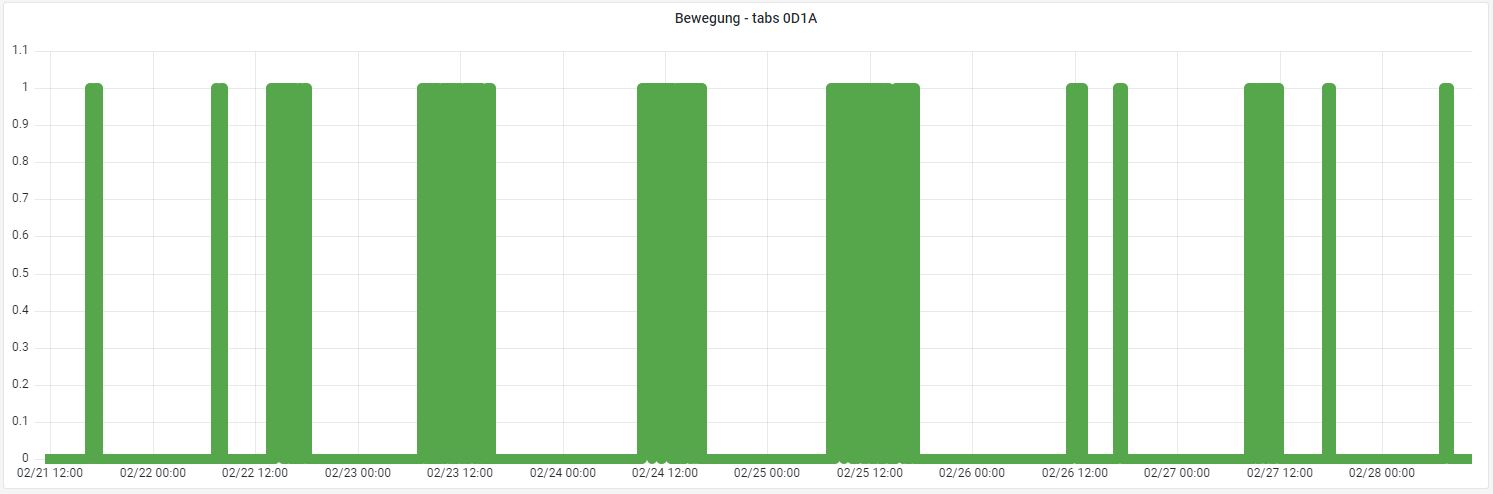
Various IoT sensors that can detect movement can be used to detect the presence of craftsmen or uninvited guests on the construction site. This example uses a Browan Tabs Motion Sensor:
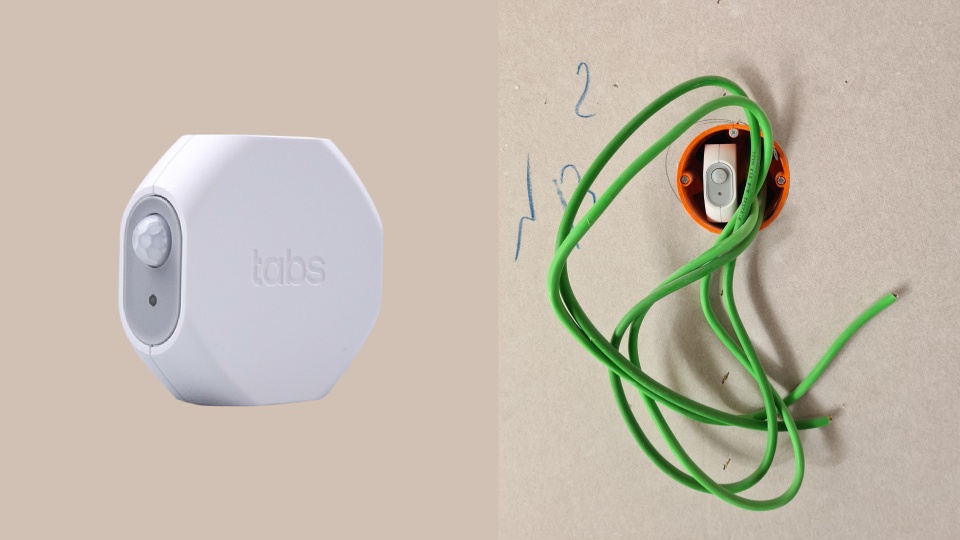
As you can see in the photo, the compact sensor is simply plugged into a still open flush-mounted box near the entrance. It is barely noticeable and is also protected from unwanted external influences. The battery-powered Tabs Motion Sensor detects movement using a dual passive infrared (PIR) detector and fresnel lens with a detection range of 7 meters. Alternatively, you can, of course, also use other sensor models. You can find a selection of other motion sensors in the ZENNERShop, for example.
2. LoRaWAN® Network for Measured Value Transmission
Access to a LoRaWAN® network is required so that the readings collected by the sensor can be sent to the appropriate systems/tools for further processing. If this does not apply to the location of your construction site, you can get it by ordering an IoT GatewayPLUS from the ZENNERShop, for example. Our Community member uses the ZENNER GatewayPLUS Indoor on his construction site. This can either be permanently installed or, as shown in the photo below, simply plugged in and placed loosely in a suitable location. This option is ideal for getting started, if you are perhaps unsure of the ideal location for your gateway.
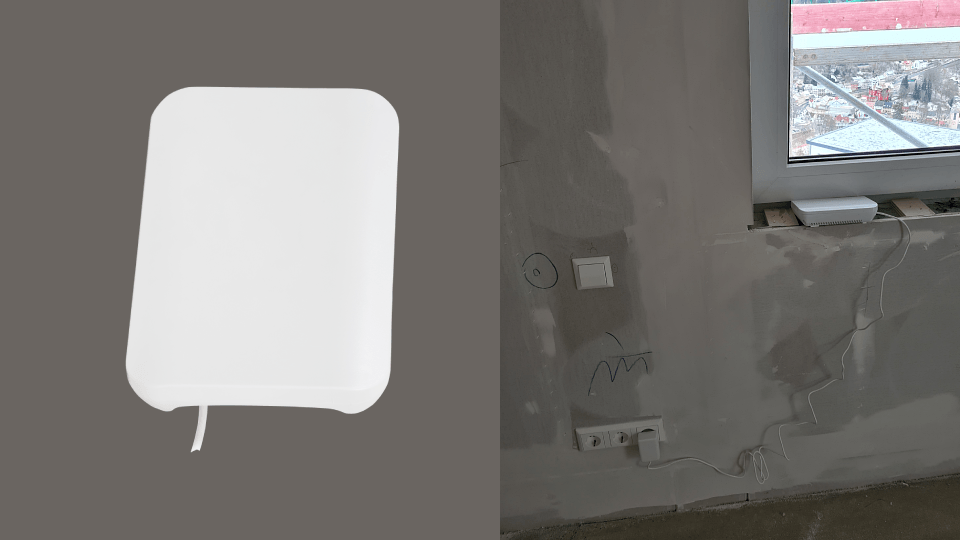
Special advantage: For data transmission, the gateway can automatically switch between cellular and Ethernet backhaul. As very few construction sites already have an Internet connection in the early stages of construction, the use of mobile communications is, of course, particularly useful here.
3. IoT Tools for Data Processing & Visualization
Now we come to the systems/tools for the further processing of the collected data. However, in order not to go beyond the scope of this article, only a rough overview will be given below, before going into detail in another article. Basically, you have the choice between paid tools that can be used “out-of-the-box”, such as the B.One Gallery, and mostly free Open Source tools. If you want to set up as little as possible yourself and do not need any individual customization options, the former is definitely recommended. Otherwise, the latter is also an exciting approach, which our Community member also chose for this application and which we will examine in more detail below.
ZENNER Datahub as Data Source
In this case, the ZENNER Datahub acts as a central data source in the background. The measurement data recorded by the sensors are received via the IoT GatewayPLUS Indoor installed in the building, parsed in the ZENNER Datahub and finally forwarded via HTTP to the endpoint created in Node-Red.
Node-Red for Application Logic
The entire logic of the use case is mapped in Node-Red. This ranges from storing the data in a database to defining the minimum time window between two presence notifications.
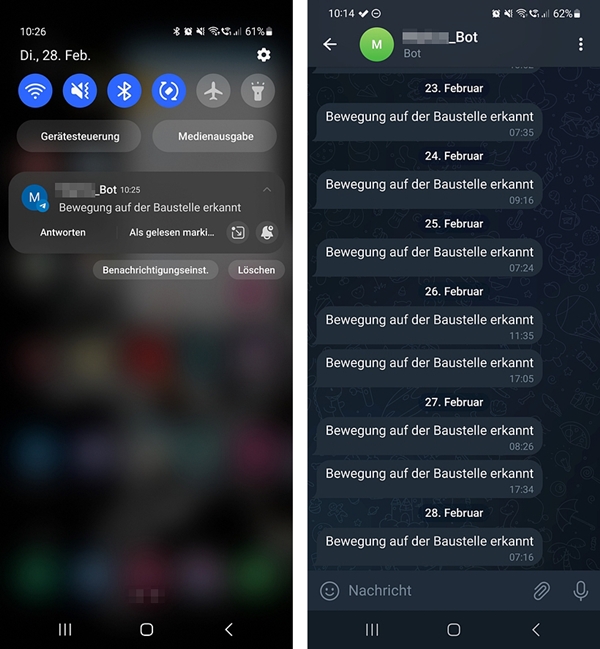
Messenger for Notification
The information about the presence on the construction site is provided via an automatically sent notification. This is configured via Node-Red and then sent to the recipient(s) via the Messenger Telegram.
Grafana for Data Visualization
In addition to ad hoc notifications, you may also want to analyze historical attendance data and track it over time. For this purpose, the data stored in the database can be visualized using Grafana.
Technical Implementation in Detail
You have now been given some ideas for possible IoT applications on your own construction site, learned which advantages of LoRaWAN® as a transmission standard are particularly important there, and, using the specific use case of presence monitoring as an example, seen what a possible basic setup for practical implementation can look like. In the second article we go into more detail about the technical implementation. Above all, this includes the interaction of the systems/tools used and setting up an alarm notification via Telegram. In addition, there are further insights into the dashboard itself.
Are you already implementing your own IoT use cases on the construction site? Or do you have other application ideas? Then share your experiences or ideas and exchange with each other here in the Community 🙂


Responses