LoRaWAN® on the Construction Site: Technical Implementation of Presence Monitoring
Last modified on 11th April, 2024
In the article “LoRaWAN on the Construction Site: Advantages, Use Cases & Practical Example” we gave some suggestions as to which useful use cases can be implemented there with LoRaWAN®, which advantages this transmission standard has to offer here in particular, and, using the example of presence monitoring, presented a possible basic setup for implementation in practice. Now let’s take a closer look at the technical implementation. You will learn how the systems/tools used interact with each other and how an alarm notification can be set up via the Messenger Telegram.
Interaction ZENNER Datahub, Node-RED, Telegram & Grafana
Before we look at the individual systems/tools, let us first get an overview of the overall construct using the following diagram:
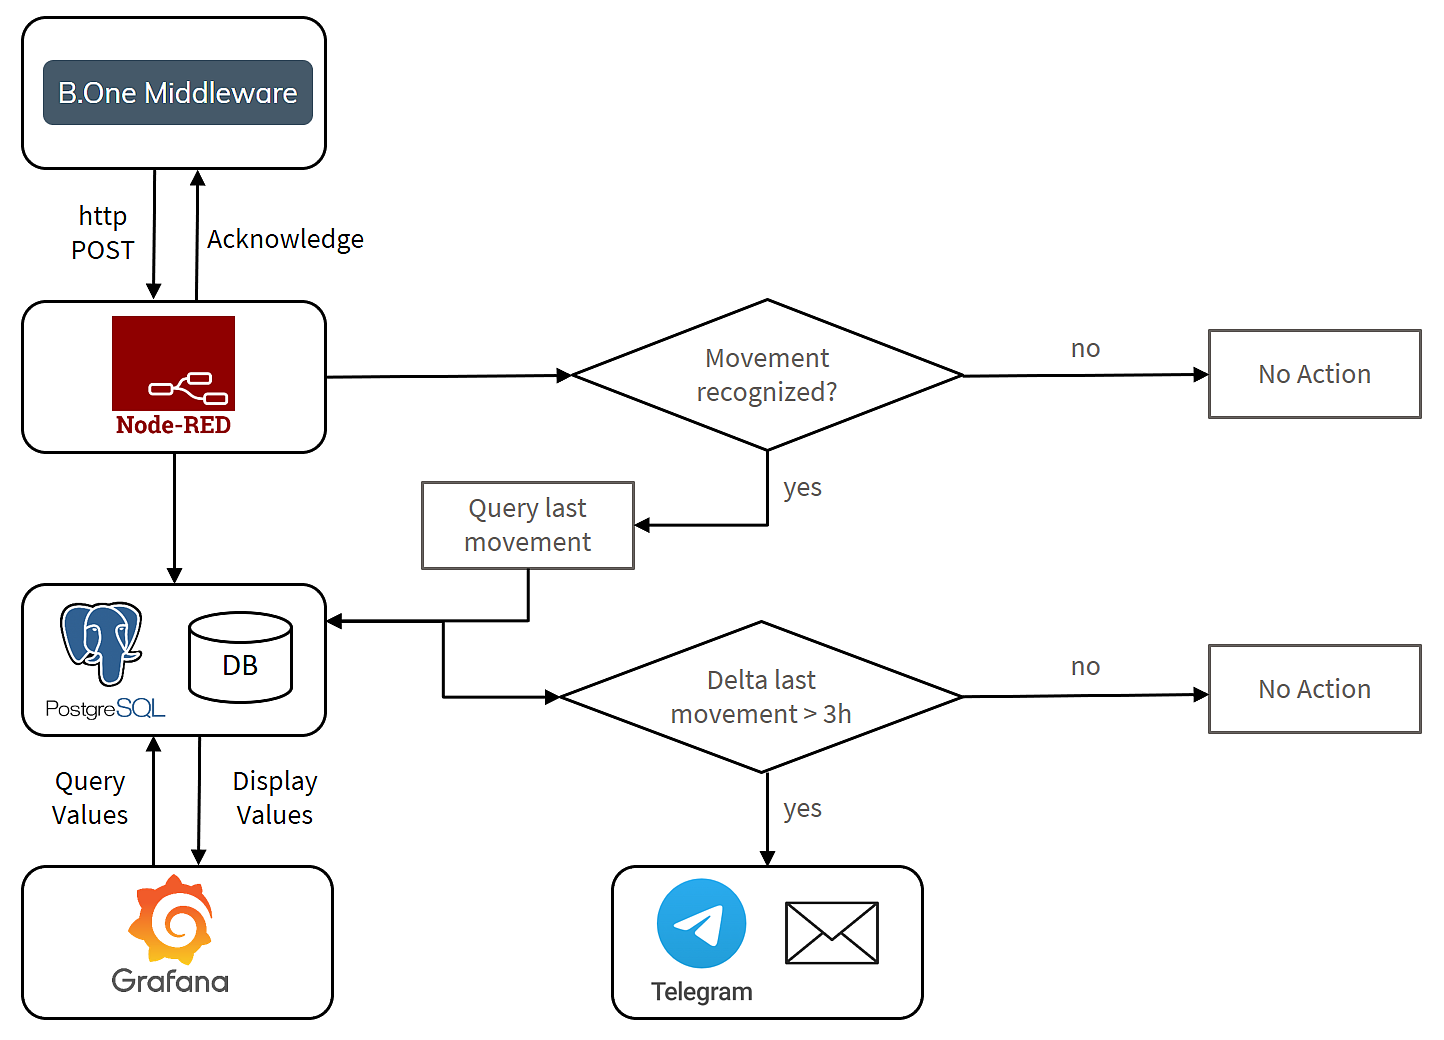
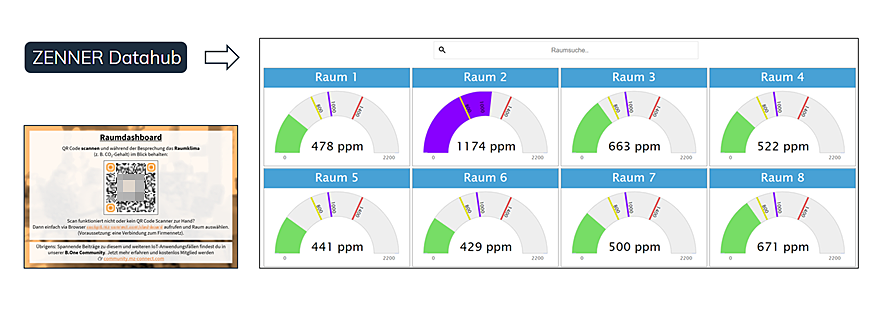
The ZENNER Datahub forwards the data collected by the sensors via http POST to the http endpoint provided via Node-RED.
The complete logic of the use case is mapped within Node-RED. The http endpoint confirms receipt of the data to the ZENNER Datahub.
Besides the acknowledgement, there are two other logical paths: The first one takes all received data telegrams and stores them in a Postgres database. The second path checks whether the current telegram contains the information that the sensor has detected movement on the construction site. If so, it reads the time of the last motion report from the database and checks whether the time difference is above a defined threshold. If the check is positive, a Telegram message will be sent informing you of the motion detection. How to set this up is explained below.
At the same time, you have also always the option to view the current data in a tool like Grafana. The visualization platform graphically displays the data stored in the Postgres database.
The basis for the processes described below is, of course, a device created in the ZENNER Datahub that is provided with an http forwarding rule.
Mapping Application Logic in Node-RED
In order to be able to implement the use case as described, a virtual machine (VM) is required that is accessible from the Internet via a fixed IP address/URI. The open-source tool Node-RED is installed on it and made available, for example, under the subpath “/nodered”. The screenshot below shows the “flow” created in Node-RED:
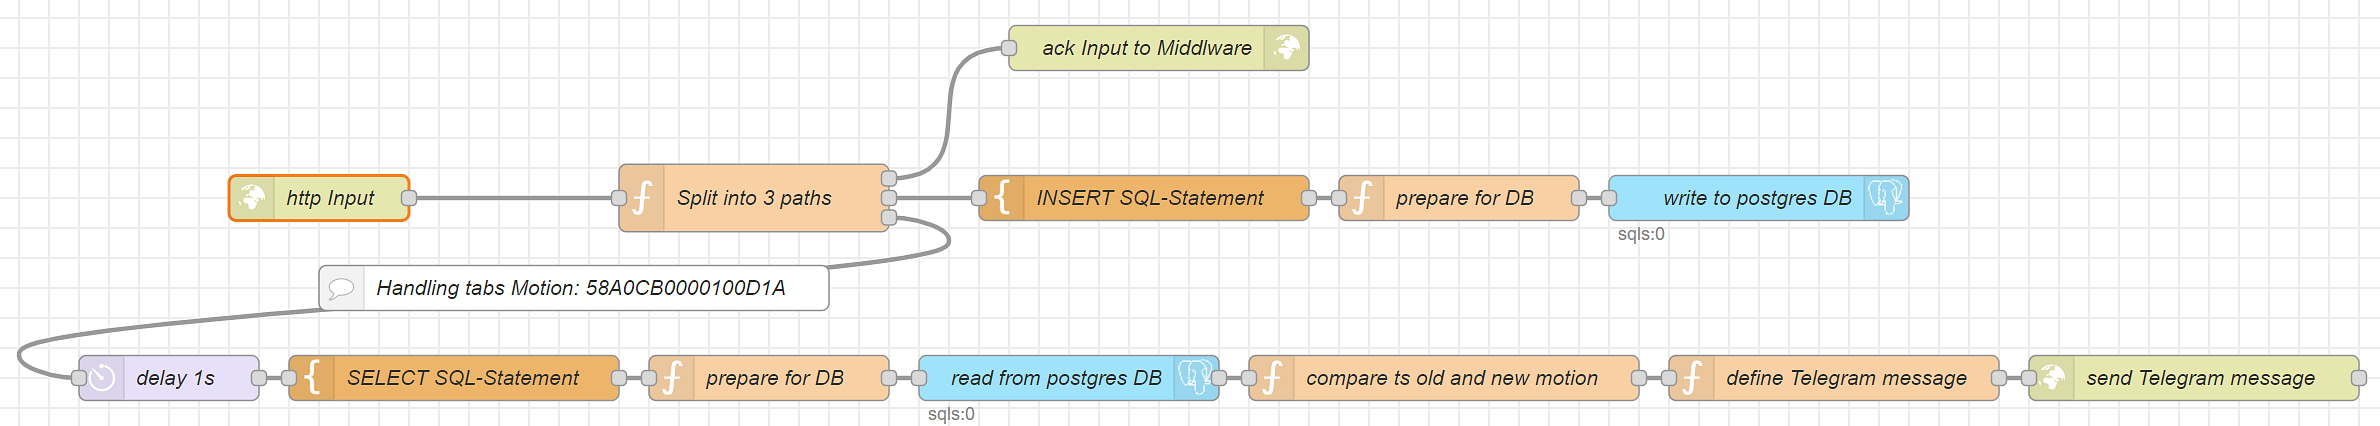
Start is the http input, which receives the data from the ZENNER Datahub. All you need to do is define a subpath and the http method (in our example POST) that will be used to access the http endpoint from the outside. The forwarding URL to be entered in the ZENNER Datahub consists of the URL under which Node-RED can be reached (red) and the defined subpath (blue). For example “myiotproject.com/nodered /httpinput“.
The data is delivered as a JSON object with all relevant information such as DevEUI, timestamp of receipt, parsed values and much more. From the input, the data first goes into a function that takes the relevant information from the JSON document and splits the rest of the process into three paths:
- Confirmation of the http post from the ZENNER Datahub to our endpoint. If there is no confirmation, the ZENNER Datahub will make two further attempts to forward the data, each after a delay. This path is always followed.
- Writing the data to a Postgres database. The JSON object is checked using if statements: Is all the required data present? If so, they are forwarded, converted into an INSERT SQL statement by the following node and finally written to the database. Otherwise the path will not be executed.
- The third path is only executed if the sensor returns the parsed value “motion” == “on”, i.e. motion has been detected. In this case, the timestamp of the last detected movement is read using a SELECT SQL statement. In addition to the read result from the database, the information about the currently detected movement is also stored in the path, so that the two timestamps can be compared using the “compare ts old and new motion” function. To avoid being overwhelmed by too many notifications when there is continuous movement on the construction site, a threshold value is stored here: Only if more than three hours have passed since the last movement is the path continued and a Telegram message sent. Of course, you are free to choose this threshold and adjust it at any time to suit your needs. You may need to play around a little with this at first to get closer to your ideal value.
Set up Telegram Notification
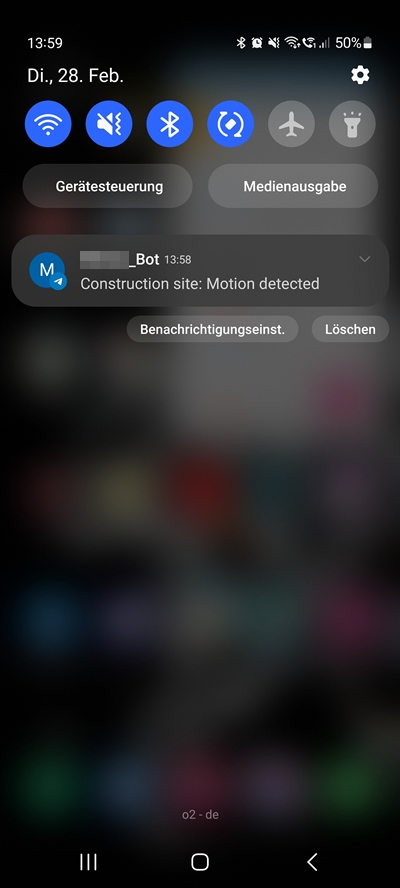
In order to be able to send automated Telegram messages, it is necessary to set up a Telegram bot, as we have already shown you in the blog post “Grafana Howto: Setting up Alerts using Telegram as an Example“. This is done in a user-friendly way via the “BotFather” wizard within the application. After entering some information, such as the bot’s username, the wizard will give you a token that you can use to authenticate yourself when sending messages, for example. Now you can invite the bot to a group – this has the advantage that you can later add other users/recipients who are also interested in the movement status. Each group is uniquely identified by a so-called chat ID. With the help of the API token and the Chat ID, messages can be sent to the group automatically. To do this, Telegram provides an http endpoint to which the API token, the Chat ID and the desired message are sent, whereupon the bot posts the content to the group. In the Node-RED flow shown above, the information that movement has been detected on the construction site is sent by a node of the type “http request”.
Here is another example of a Telegram notification received on a smartphone:
Set up Grafana for Data Visualization
In addition to ad-hoc notifications about current movements on the construction site, it is always interesting to be able to track their history – for example, when craftsman A was on the construction site a week ago or how long colleague B was busy with levelling on Monday. To answer these and similar questions, it makes sense to set up a visualization tool that graphically displays the values stored in the database. As already mentioned above, the open source tool Grafana is used in this case study. This is installed on the same VM as Node-RED and made accessible via the above mentioned subpath “/grafana”. In Grafana, a “Time Series” panel is created in a dashboard. The Postgres database, into which the data is written by Node-RED, is created as a data source in Grafana. An SQL statement can now be stored that retrieves the desired data and displays the result over time. The visualization can now be customized to suit your needs.
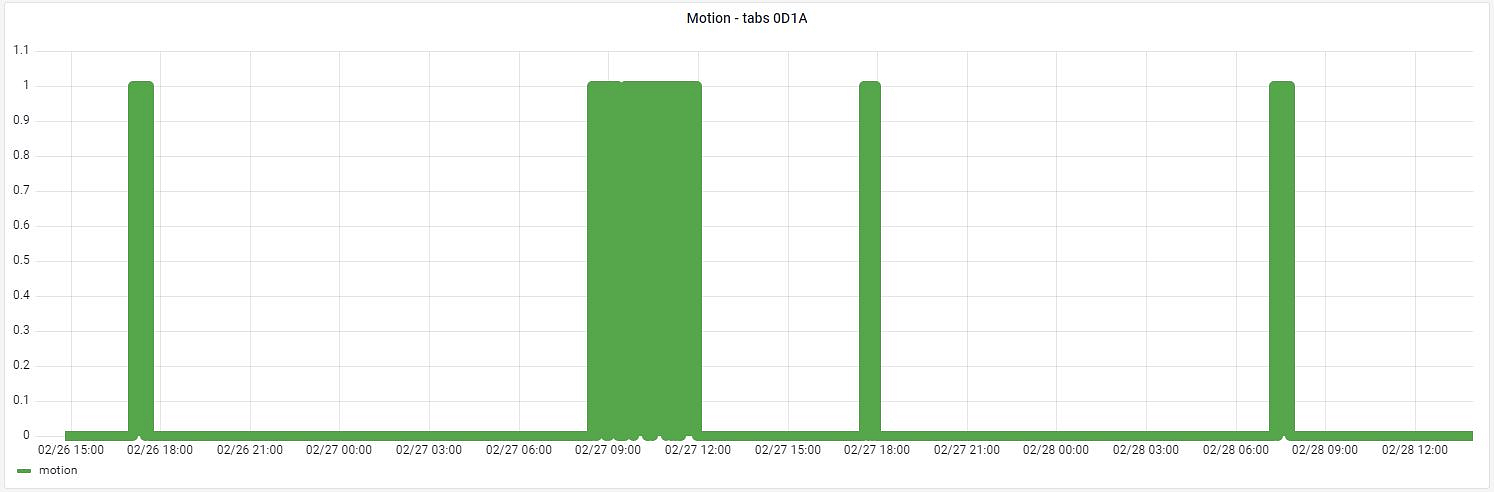
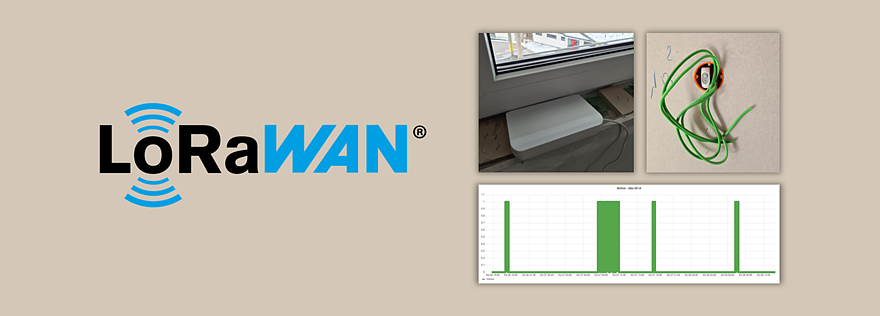
Here is the example time course diagram from the previous post again:
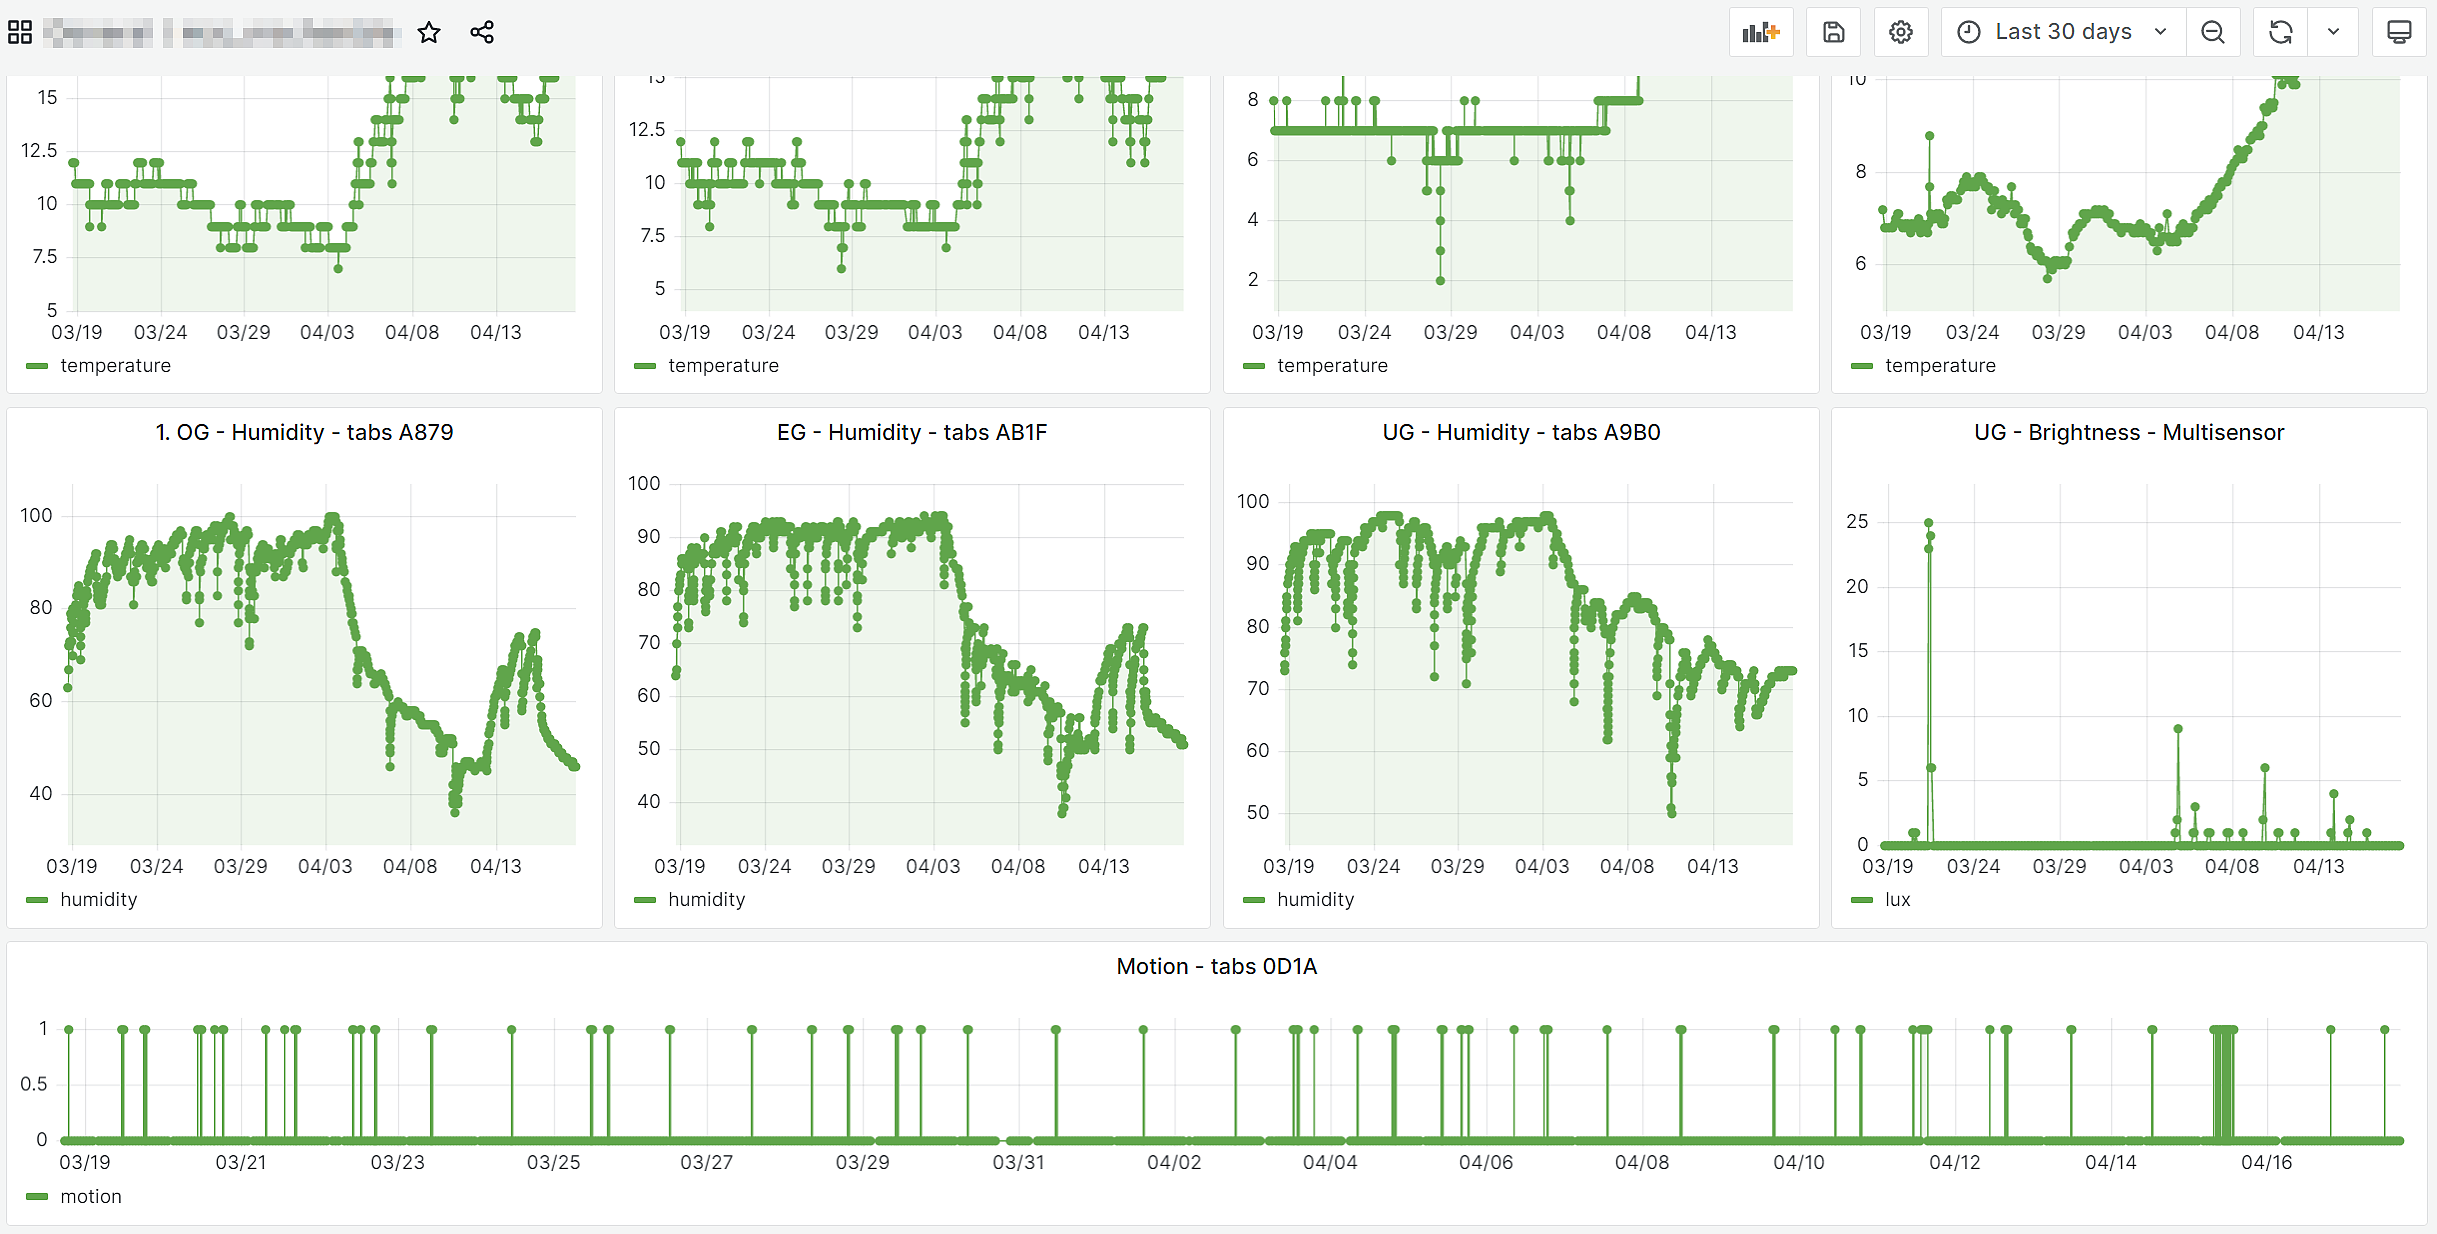
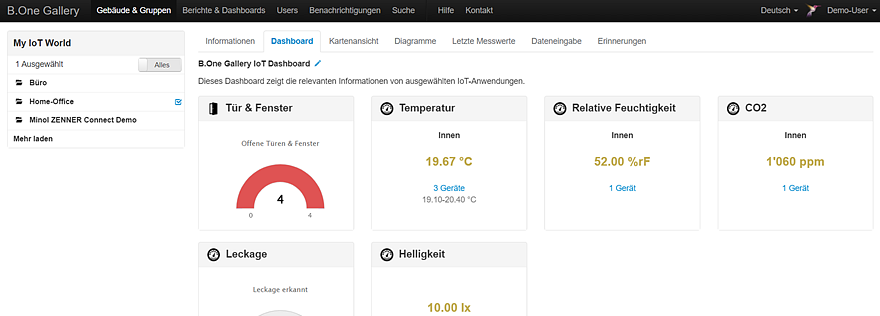
And here is an example of a complete dashboard with multiple sensors:
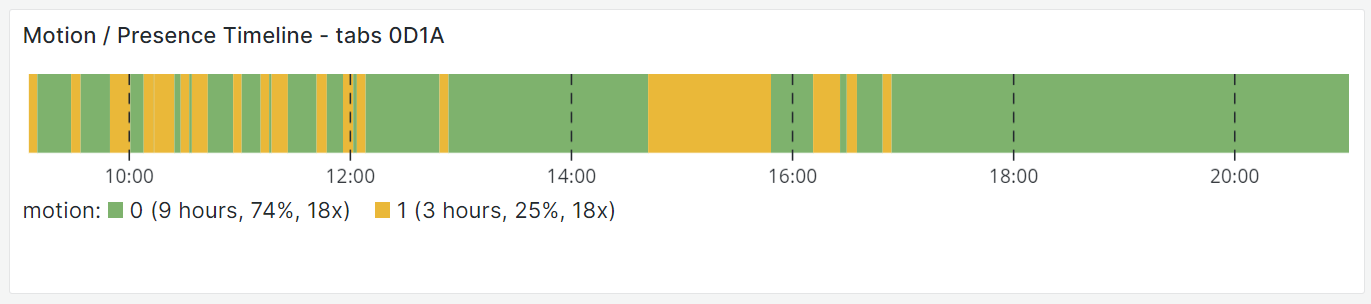
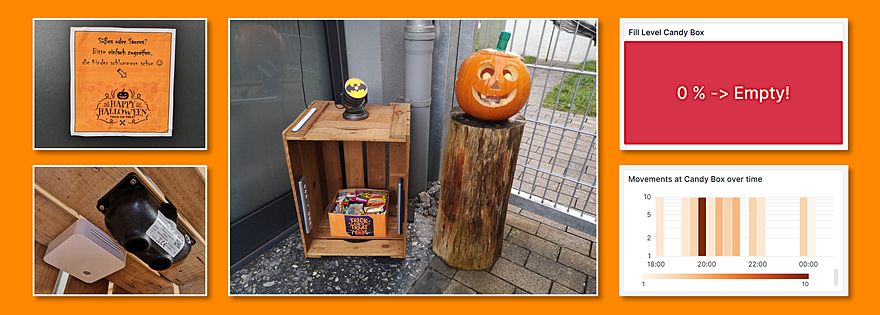
Extension with the Grafana Plugin “Discrete”
After there was a reference to the Grafana plugin “Discrete” in the comments (see below), another view was added to the dashboard. With the help of this plugin, the attendances can be displayed even more clearly in a horizontal timeline. This makes it even easier to see at what times or in which periods someone was on the construction site. Depending on the configuration of the panel, it can also be displayed, for example, how many hours per day someone was on site in total.
You have now seen how you can technically implement the use case of attendance monitoring on your construction site using the ZENNER Datahub and open source tools, as one of our community members has done. Do you have any questions about this or have you already had your own experiences with it? Then talk about it and just share it in the comments 🙂

Responses