IoT in Homeoffice & Office: Healthy Room Climate with the Help of LoRaWAN® Part 2 – Connection of an IoT Platform
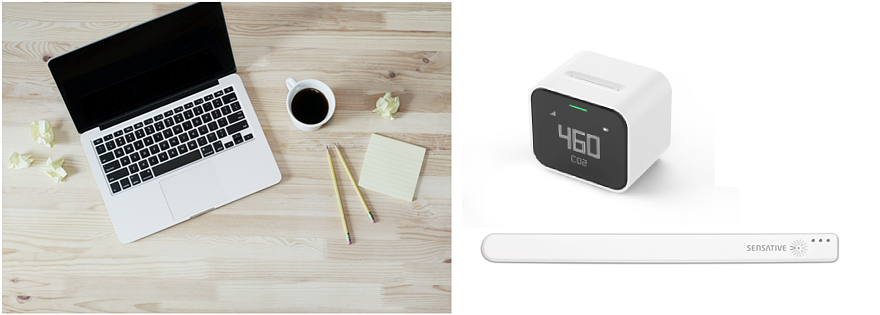
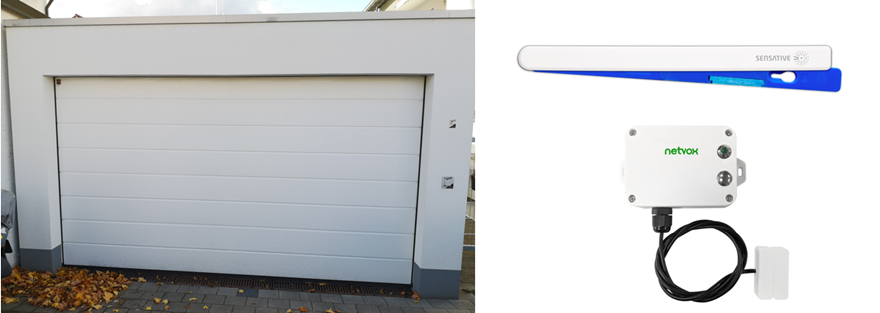
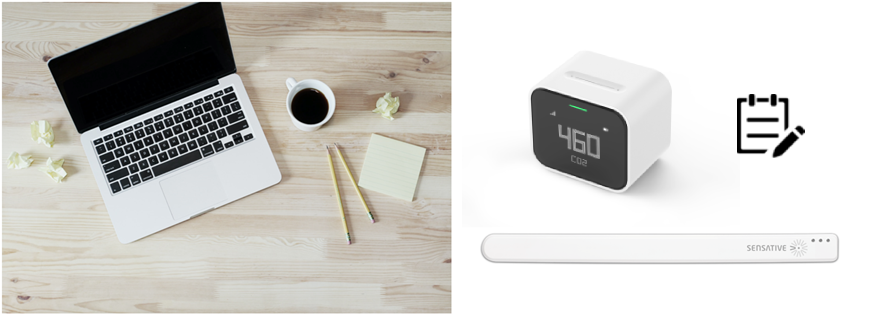
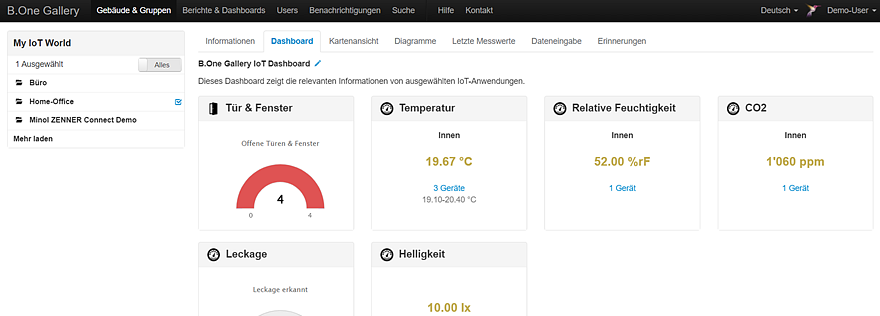
– 📖🕓 ≈ 7 min – Most recently, it was shown here how you can ensure a healthy indoor climate with IoT sensors and the B.One Gallery, for example in the home office or office. Experience in part
1 of my personal experience report on how I fared with the setup and monitoring of the CO2 level and temperature in practice.
– 📖🕓 ≈ 7 min – A healthy working/room climate is an important factor for high productivity in the home office and office. Find out how you can ensure this using LoRaWAN® sensors and a connected IoT platform. In part 1 of the two-part series, we first go into the theoretical basics and the installation of the appropriate sensors.
– 📖🕓 ≈ 6 min – Article last updated: 01/31/2022 After I get you in Part 1 and Part 2 of this series of posts showed what you can do about…
– 📖🕓 ≈ 7 min – Last week, in Part 1 of this small series, I showed you which components you can basically use to monitor your garage door using IoT/LoRaWAN®…
– 📖🕓 ≈ 4 min – This shouldn’t be rocket science anymore, one would think. Mhm, but actually I don’t want to deal with the technology at all, I just want…
– 📖🕓 ≈ 7 min – [Update des ursprünglichen Artikels vom 22.07.2022] The use of LoRaWAN® sensors in combination with a dashboard is ideal for monitoring the indoor climate in meeting rooms. That is why we are showing you in a small series of articles how a self-programmed indoor climate dashboard tailored to individual requirements based on our IoT platform B.One Middleware can look like.
In part 1 of this small series, we laid the foundations for monitoring the working/room climate in the home office and office with some theory and the installation of IoT sensors. Today we complete the whole thing with the connection to the IoT platform B.One Gallery. This includes the initial activation of the devices, the visualization of the data and the setup of notifications .
After placing the sensors in the room, it's now time to get the data into your IoT platform, where you can view the data visually and set up appropriate notifications for significant status changes. In this case, as already mentioned, we use the B.One Gallery visualization tool. You don't know the tool yet? Then we recommend the article “ B.One Gallery Visualization Tool – An Introduction ”.
Before your sensors can send data to an IoT platform like the B.One Gallery, they must be initially activated and the so-called “Join process” can be initiated with the LoRaWAN® network . Prerequisite : They have already been created in the systems/platforms used for the network, in this case in the B.One Middleware (used for data transmission/forwarding and gateway administration) and in the B.One Gallery. If you order the sensors with the additional option ZENNER IoT PLUG&PLAY already mentioned in part 1 of this two-part series, this will be done for you automatically and you can start with the activation directly.
To start the join process with the ZENNER CO 2 indicator, all you have to do is switch the device on by pressing the on/off button for a long time. After that, the process starts automatically. You can see whether this was successful by the fact that the LoRaWAN® reception bars are permanently displayed at the top left of the display and no longer run from left to right.
With the Sensative Strips sensors, the whole thing works a little differently, as there is no on/off button or similar. Instead, the sensor is in transport/sleep mode when delivered and has to be woken up. To do this, either simply remove the two magnets attached to the sensor or if the join process has not yet taken place automatically, hold the supplied magnet on the rounded side of the strip three times. You can tell whether the join process was successful by the fact that the LED display lights up green for a little longer.
Let's now look at how the data is visualized in the B.One Gallery and how you can be notified of certain status changes or the reaching of certain threshold values.
The dashboard of the B.One Gallery shows you the latest sensor values and thus the prevailing room climate at a glance. For example, if you have grouped the sensors in your office into a separate device group, you can simply select them (instead of all individually). On the other hand, if you use one or more subgroups for these sensors, then simply select the appropriate ones.
In addition to viewing the current values in your dashboard, you can also create an individual report so that you can share the data with others via a link if necessary, or access it quickly via a shortcut on your desktop or smartphone. Less relevant in the home office, of course, but very practical in the office on site, for example to make the data available to colleagues without access to the gallery or to pack it on a dashboard that is visible to everyone.
In the video you can see how we created such a report for this application and added the visualization of the CO2 level as an example:
https://community.mz-connect.com/wp-content/uploads/2021/12/2021-12-15_10-b-one-gallery-bericht-erstellen-raumklima-home-office-co2.mp4To add the other parameters in the form of the dashboard view or as a diagram, you simply proceed in exactly the same way.
You can easily set up and manage notifications via email or SMS for certain status changes in the B.One Gallery under the menu item of the same name “ Notifications ”. For example, to receive a notification when the CO 2 level rises above 1,000 ppm, simply do the following:
Here's the whole thing again in the video:
https://community.mz-connect.com/wp-content/uploads/2021/12/2021-12-15-b-one-gallery-benachrichtigung-erstellen-co2-gehalt.mp4This procedure also applies to all further desired notifications for the other parameters.
A notification in your mailbox will then look like this:
This sets up a practicable setting for monitoring the working/room climate in the office and home office. So nothing stands in the way of high productivity of course, the whole thing can then be flexibly supplemented with additional sensors, for example to monitor parameters such as the noise level.
As always, questions, suggestions, feedback or shared experiences are welcome in the comments!
And other helpful articles about the B.One Gallery can be found in the blog category of the same name.
COOKIES: