IoT and Me 2021: Insights into my project “Smart home – feel good”
First of all, for all those who have not yet discovered my profile in the block article “IoT and Me” – Competitors introduce themselves and their applications and do not know me yet:
My name is Larissa Quinci, I’m 21 years old and I come from Radolfzell on Lake Constance. I am currently completing an apprenticeship as an office management clerk at Minol in the Singen branch.
I am currently taking part in an “IoT and Me” competition for students and trainees. In this regard, we were provided with a starter set with LoRaWAN-capable sensors such as the Sensative Strips Multi Sensor +Drip , a Sensative Strips Presence and a Tabs Object Locator in order to implement a useful IoT application idea for everyday life. In addition, we were given access to visualization tools such as the B.One Gallery, B.One Middleware and Grafana in order to implement the use case.
In this blog post I will share some insights about my competition project.
My Use Case: General Room Air Monitoring
My project involves measuring air quality, humidity, brightness and room temperature. My ulterior motive was to always keep an eye on the values, for example to prevent migraines. It not only triggers migraines, but also eye, skin and mucous membrane irritations, colds and, in the worst case, respiratory problems if the air humidity is too low, for example.
Which Sensors do I use for this?
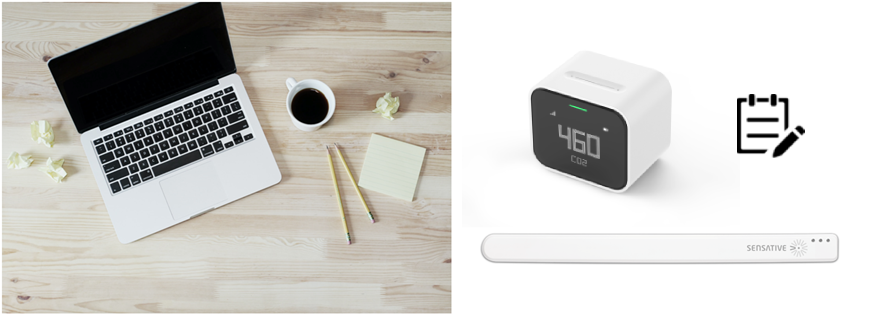
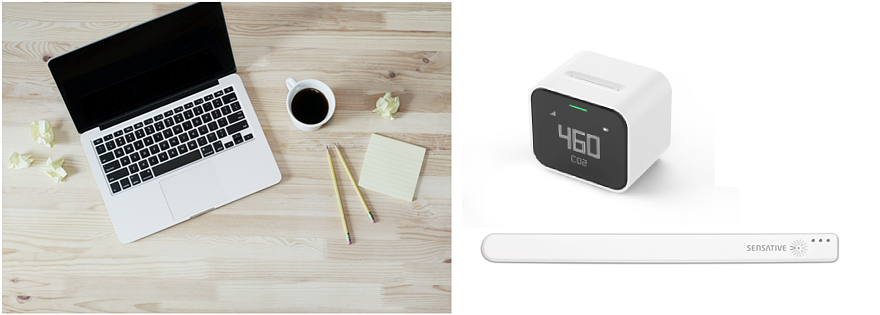
I use the ELSYS ERS CO² sensor for this.
This ELSYS ERS CO² sensor has the ability to measure these 4 factors. It is suitable for private households as well as for workplaces and is equipped for easy configuration with an Android mobile phone, for example. I tested the whole thing in my Minol branch. For this I use Grafana that sends regular updates as a message that I have deposited myself. These then appear on Telegram. 
Possible attachment of the ELSYS CO² sensor
It is best to install the sensor in rooms where people spend most of their time, e.g. B. living room, bedroom, etc. In my case, I carried out the development time in the company and measured the values in the server room.
Tabs Object Locator Sensor
This sensor is a GPS tracker that always sends the last location. However, you could also use this to check reminders and send notifications by pressing the side button. For example, people often forget to drink at work. And this, too, can lead to severe migraines in connection with the factors already listed. Here, you simply press the button as soon as you have drunk. The Tabs sensor recognizes that the “command” has been executed and then reminds you again after an hour, for example. I did the same in the business. I always had the sensor on my desk for this purpose.

Implementation of the Use Case
I did the development time in the company. However, in my case, the idea would have been for the private household. However, it is advantageous that the sensor, as already mentioned, can be used for private households as well as for workplaces.
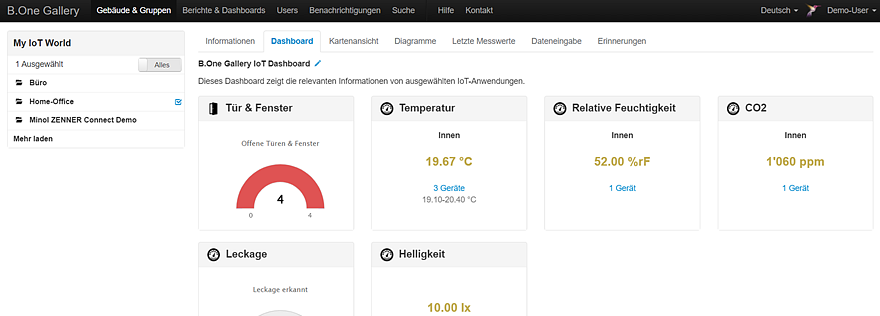
First of all, access to the visualization tools mentioned above was set up for us, with which the corresponding values can then be measured.
I have decided to use Telegram as the message transmitter.
Once I set up Telegram, I was able to really get started. In Grafana there are various graphics in which you can read the extract values. These must be configured.
Now I have started to store a command for each value, e.g.:
The picture shows a command that I deposited.
And so I stored this for all values and checked whether I actually received messages with the corresponding commands.
An additional measurement is carried out every 5-10 minutes as soon as the measured values remain too high or too low. If these are still too high or too low, a warning message is sent on Telegram.
I duplicated each graph in Grafana so that two values can be measured for each factor. In this case, once the value is above or below the desired one.
How are these factors queried at the same time?
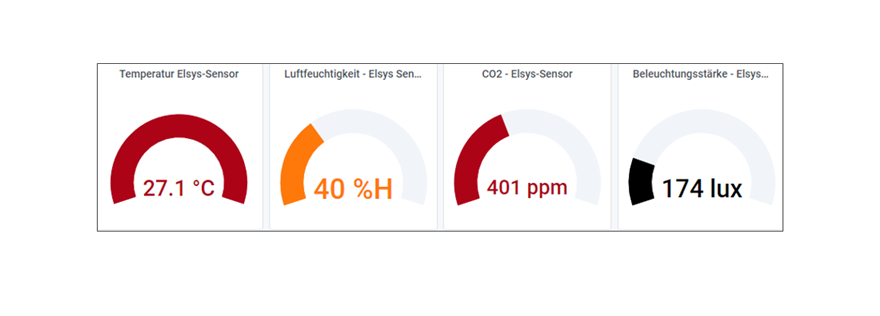
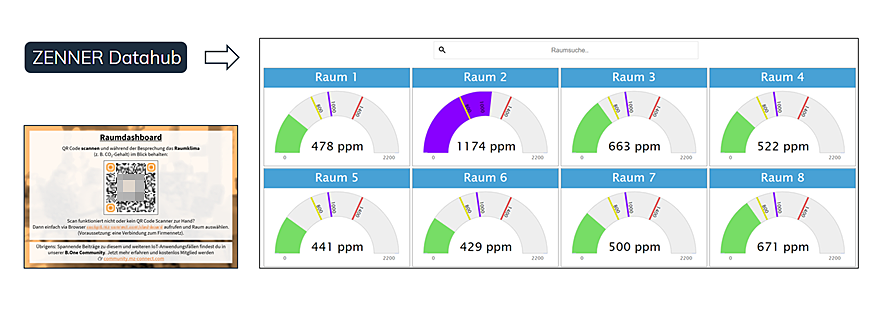
Grafana – Visualization of the ELSYS CO² Sensor in the Dashboard

The graph shows the factors to be measured. The values are queried in combination with each other, since all values should be in the optimal range.
In the image below you can see the message related to the 4 factors. These are queried at the same time, so you have all the values at a glance and under control.

Which sensors do I not use and why?
Initially I had actually decided on another idea with which I would have needed the 2 sensors (Sensative Strips Multi Sensor +Drip, Sensative Strips Presence). However, there were slight starting difficulties with these sensors. Both sensors could not transmit any information or accept the sent downlinks from the middleware. And so they had to be completely reconfigured for the first time.
When we then had the conversation with the mentors, my decision regarding the idea changed. And so I continued to consult with the responsible colleagues and finally received a CO² sensor.
My biggest Challenge in the Implementation
The biggest challenge for me was to measure the exact air quality and to combine the 4 factors. Because everyone who suffers from migraines experiences migraines differently. It was therefore my task to implement the application in such a way that action can be taken as quickly as possible if the values are worse.
More “Must Haves” & Short Interview
During the development time, an outlook came to my mind that allows this use case to be further expanded. It might be helpful to many out there as well. But I not only announced my further ideas regarding the outlook, but also the development of the idea and possible difficulties as well as successes in a short interview.
Recommend0 recommendationsPublished in Grafana, Minol ZENNER – IoT and Me, Minol-ZENNER Group, Use Cases, Visualization

Responses