Internet of Things (IoT) – it’s quite simple…
This shouldn’t be rocket science anymore, one would think. Mhm, but actually I don’t want to deal with the technology at all, I just want to use the advantages and I believe that many people feel the same way. Ok, I understood what LoRaWAN is, how it works, what advantages it has. But I don’t want to have to be a technical expert just to use it. That’s why we at BMZ have tried to make the whole topic as simple as possible for users.
The use case as a starting point
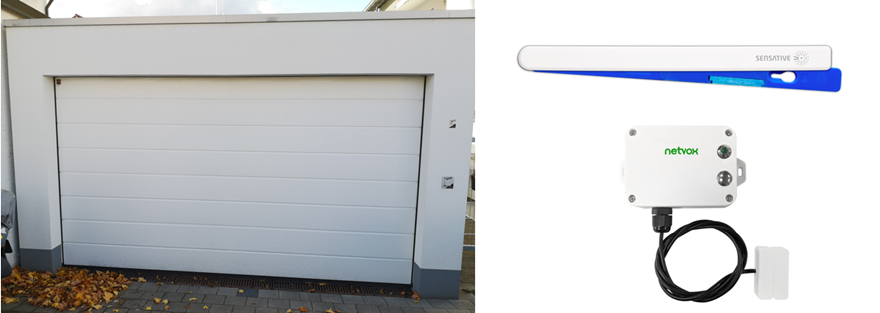
The starting point is actually always the same, you know what you want to do, e.g.B. do you want to know what temperature and humidity or CO2 values in your office, meeting room, warehouse, basement, cold room, greenhouse etc prevail. Let’s say you have temperature-sensitive goods in your cold room, fruit or groceries, or plants in the greenhouse. You want to be sure that if the temperature rises or falls below or above a certain value, you will receive an email or SMS notification.
The general implementation
What do you need for that? First of all, a sensor that measures the temperature, humidity, etc. and can simply send this through the wall of the cold room, possibly also through the basement, and all of this, please, without an additional power connection for each sensor. The transmitted values should be safe and only be able to be read by you and also arrive safely. Oh yes, and only very little energy should be required for this data transmission, so that the battery of the sensor does not have to be constantly replaced. Well, this is LoRaWAN . The data packets from the sensor are received by a receiving station (gateway) and this then forwards the packets to the so-called backend system via a radio network or cable network. The system recognizes which of the data packets come from your sensors. Of course, you first have to tell the network which sensor belongs to whom. Then the data is output in a raw format, relatively cryptic and incomprehensible. So you have to translate them with a so-called parser. The data packet contains, for example, a temperature value in Celsius and it reads 15 degrees.
So that you can now also get this nicely displayed on a timeline, you have to visualize it, i.e. you use visualization software. In this one must also specify what kind of data is from what kind of network and how it is then to be displayed. In order to then, for example, display the temperature profile of the last week. It would be great if you could simply send the graphic to someone else, and then whenever he clicks on the link he sees the most recent progress, i.e. the report is then automatically updated.
That’s great, yes I think so too, even better if, for example, you can easily set when the temperature is too high or too low that you would then like to receive an e-mail or SMS that warns you. “Hello, the temperature is too low, the fresh meat or vegetables freeze, or too high, the goods spoil”
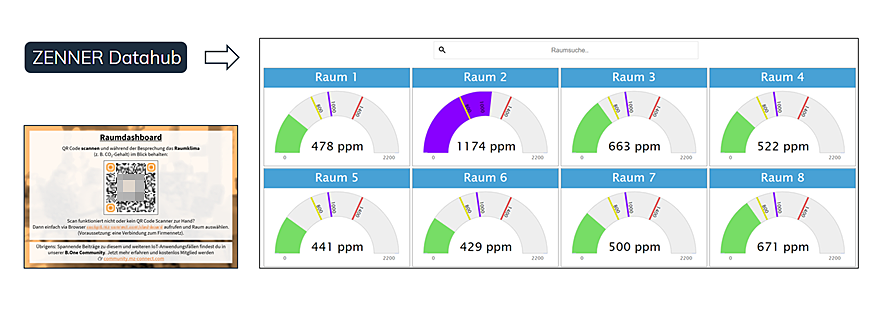
I think the problem is clear. Mhm, I really just want to be able to use it. Say I buy such a sensor, buy a gateway with network and data transmission and then I would like to be able to see all my sensor values immediately or a kind of display board (dashboard) what all my sensors are doing or to get notifications. Screwing on the sensors, setting them up and switching them on is easy, and it’s also easy to connect the gateway to a socket, similar to setting up a WLAN router.
That’s it. Wait a moment you say; I have to register the sensors in the network and how does the data get from the gateway into my software without me having to do anything?
Easy implementation with ZENNER IoT PLUG&PLAY
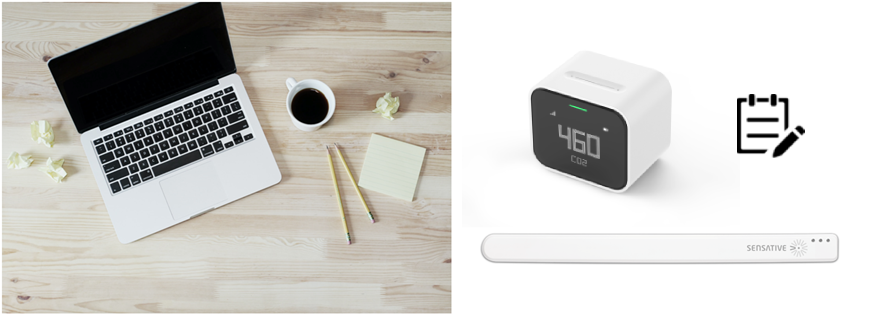
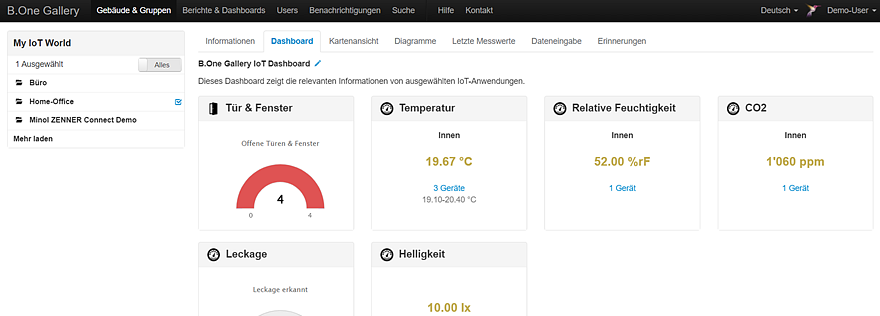
If you just want to use IoT then take a look at ZENNER IoT PLUG&PLAY with the GatewayPLUS Smart, Indoor or Outdoor. That’s exactly how ZENNER brought it together. Simply buy a GatewayPLUS, which already includes the LoRaWAN network and a SIM card for data transmission for 24 months and up to 50 sensors. The Smart does not have a SIM card, so you set up the data transfer via your WLAN. When ordering your gateway, you then select the ZENNER IoT PLUG&PLAY option, which also gives you access to the B.One Gallery visualization solution, also for 24 months and 50 devices. And now comes the best part: for selected sensors you can also select the ZENNER IoT PLUG&PLAY option when purchasing from the ZENNER shop and the ZENNER team will then do almost everything for you. In other words: tell the network that this is your sensor that you are buying and that you should receive the data, not only in your network access, but also directly in your B.One Gallery visualization solution. All you then need is internet access to access your gallery, assemble/install the sensors and the gateway and switch them on, log in to your B.One gallery and you will see the values of your sensors as soon as they start sending.
If you then want to receive a message if, as in the example, the temperature is no longer what it should be, then simply enter the values for this, for example >= 8 degrees or < 4 degrees and enter the email address to which an e-mail with which message should be sent should the worst come to the worst. It’s really very easy then.
Of course you can also use other LoRaWAN sensors. Just look at which ones are already supported or already translated (parsed) in your B.One Gallery. You then have to make them known to the network yourself and create them in your B.One Gallery. But don’t worry, that’s easy too, just not PLUG&PLAY anymore. In the ” B.One Gallery Howto: Creating sensors “, I will show you exactly how you can create your own sensors in the gallery.
I love it. And the best part is that it gives you an almost unlimited number of uses. Just look with IoT eyes where a sensor could help you… Levels, motion detectors, climate data, …
Would you like to find out more or know which sensors are available from ZENNER with this visualization option? Then have a look here PLUG&PLAY sensors.
Share gateway position with the community
If you like, you can also display your GatewayPLUS here in the B.One Community on the Community Map. I can well imagine that you already have a lot of ideas. If you have implemented something of this, then simply share your IoT use case here in the community.
Boris
Recommend0 recommendationsPublished in ZENNER IoT PLUG&PLAY
Responses