Grafana Howto: From the ZENNER Datahub via MQTT to the InfluxDB
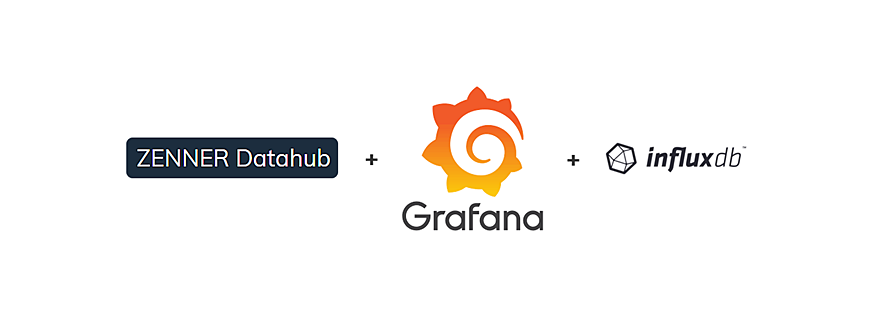
- 📖🕓 ≈ 5 min - Last modified on 10th April, 2024 In the last articles you have already been given a small introduction to the open source tool Grafana. It was also reported how to install and set up Grafana locally under Ubuntu. Today we are installing a small database for your applications on a Linux distribution and writing the first sample data, which we receive via MQTT, into the database. We then visualize the stored data in Grafana.For this