Field Report: Healthy Room Climate in the Homeoffice with LoRaWAN® Part 1 – Setup, CO2 Level & Temperature
Last updated on 07/02/2023
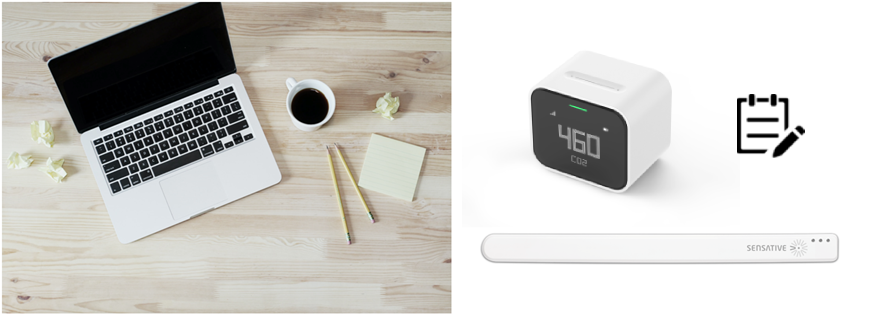
In the two blog posts “IoT in Homeoffice & Office: Healthy Room Climate with the Help of LoRaWAN® Part 1 – Basics & Sensors“ and „IoT in Homeoffice & Office: Healthy Room Climate with the Help of LoRaWAN® Part 2 – Connection of an IoT Platform“ is shown how you can ensure a healthy indoor climate in the homeoffice and office with LoRaWAN®. I tested the setup described in it, consisting of the IoT sensors Sensative Strips +Comfort and ZENNER CO2 Indicator as well as the visualization tool B.One Gallery, for myself in my homeoffice. You can find out how I felt about it and what insights I was able to draw from it in a small two-part series of articles.
In this first post, I’ll start by going into the placement of the sensors in my office, what thresholds I’ve set up notifications for, and what experiences I’ve had with monitoring CO2 levels and temperature. In a second post, I will tell you about my experiences with monitoring humidity and illuminance/amount of light, reveal whether my ventilation behavior has actually changed and draw an overall conclusion.
The Premises
Before I go into my specific experiences and insights, a few key data on the premises in which I tested the setup:
- Room size: approx. 12 square meters
- Number of windows: 1x normal window + 1x skylight
- Position of my desk/workplace: on the wall directly under the skylight with a view of the wall and window (no, it’s definitely not ideal, which should also show up 😉 )
- Lighting: Commercial grade 5W 50mA LED light bar extending across the room and mounted in the center of the ceiling
Placement of the Sensors
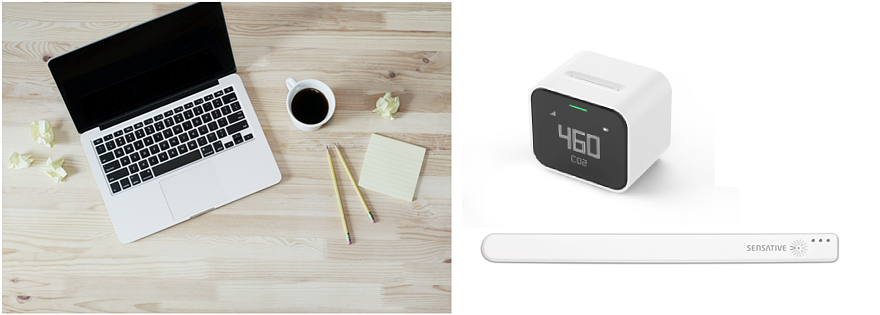
Sensitive Strips +Comfort
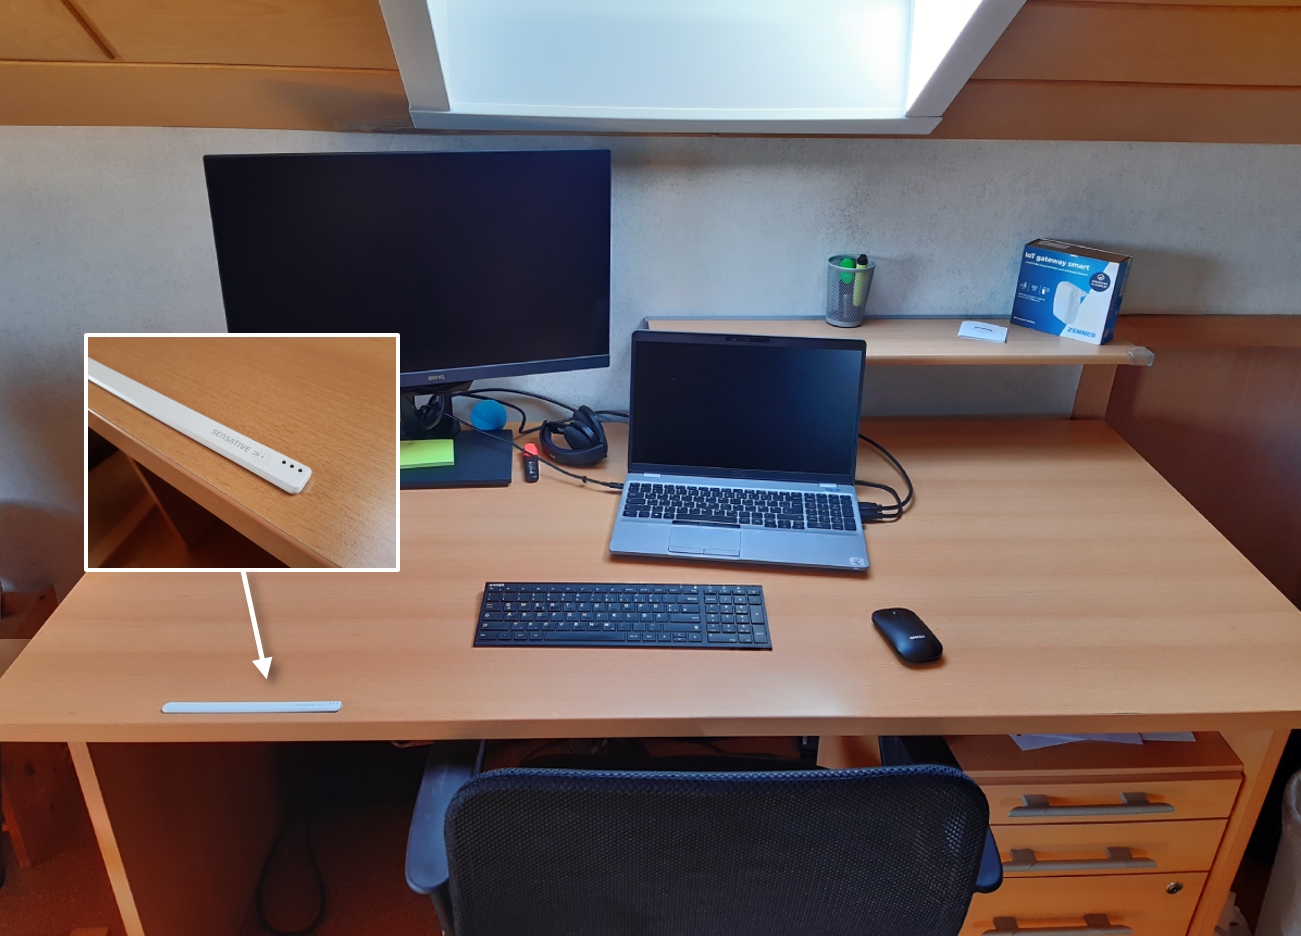
A quick reminder: In this example, temperature, relative humidity and illuminance/light quantity are measured with the Multi-Sensor Strips +Comfort from Sensative. As far as temperature and humidity are concerned, in my opinion it doesn’t really matter where you place the sensor in the room. With regard to the illuminance/amount of light, on the other hand, you should make sure that the measured amount of light also corresponds to that at your actual seat. In my case, I initially attached the +Comfort too far to the left of the desk, which means that the measured value was usually lower than the actual one. That’s why I moved the sensor so far to the right on the edge of the desk that it needed to be more directly under the skylight, but without restricting my freedom of movement at work. At first I didn’t use the adhesive strip on the back so that I could change the position quickly and easily if necessary.
ZENNER CO2 Indicator
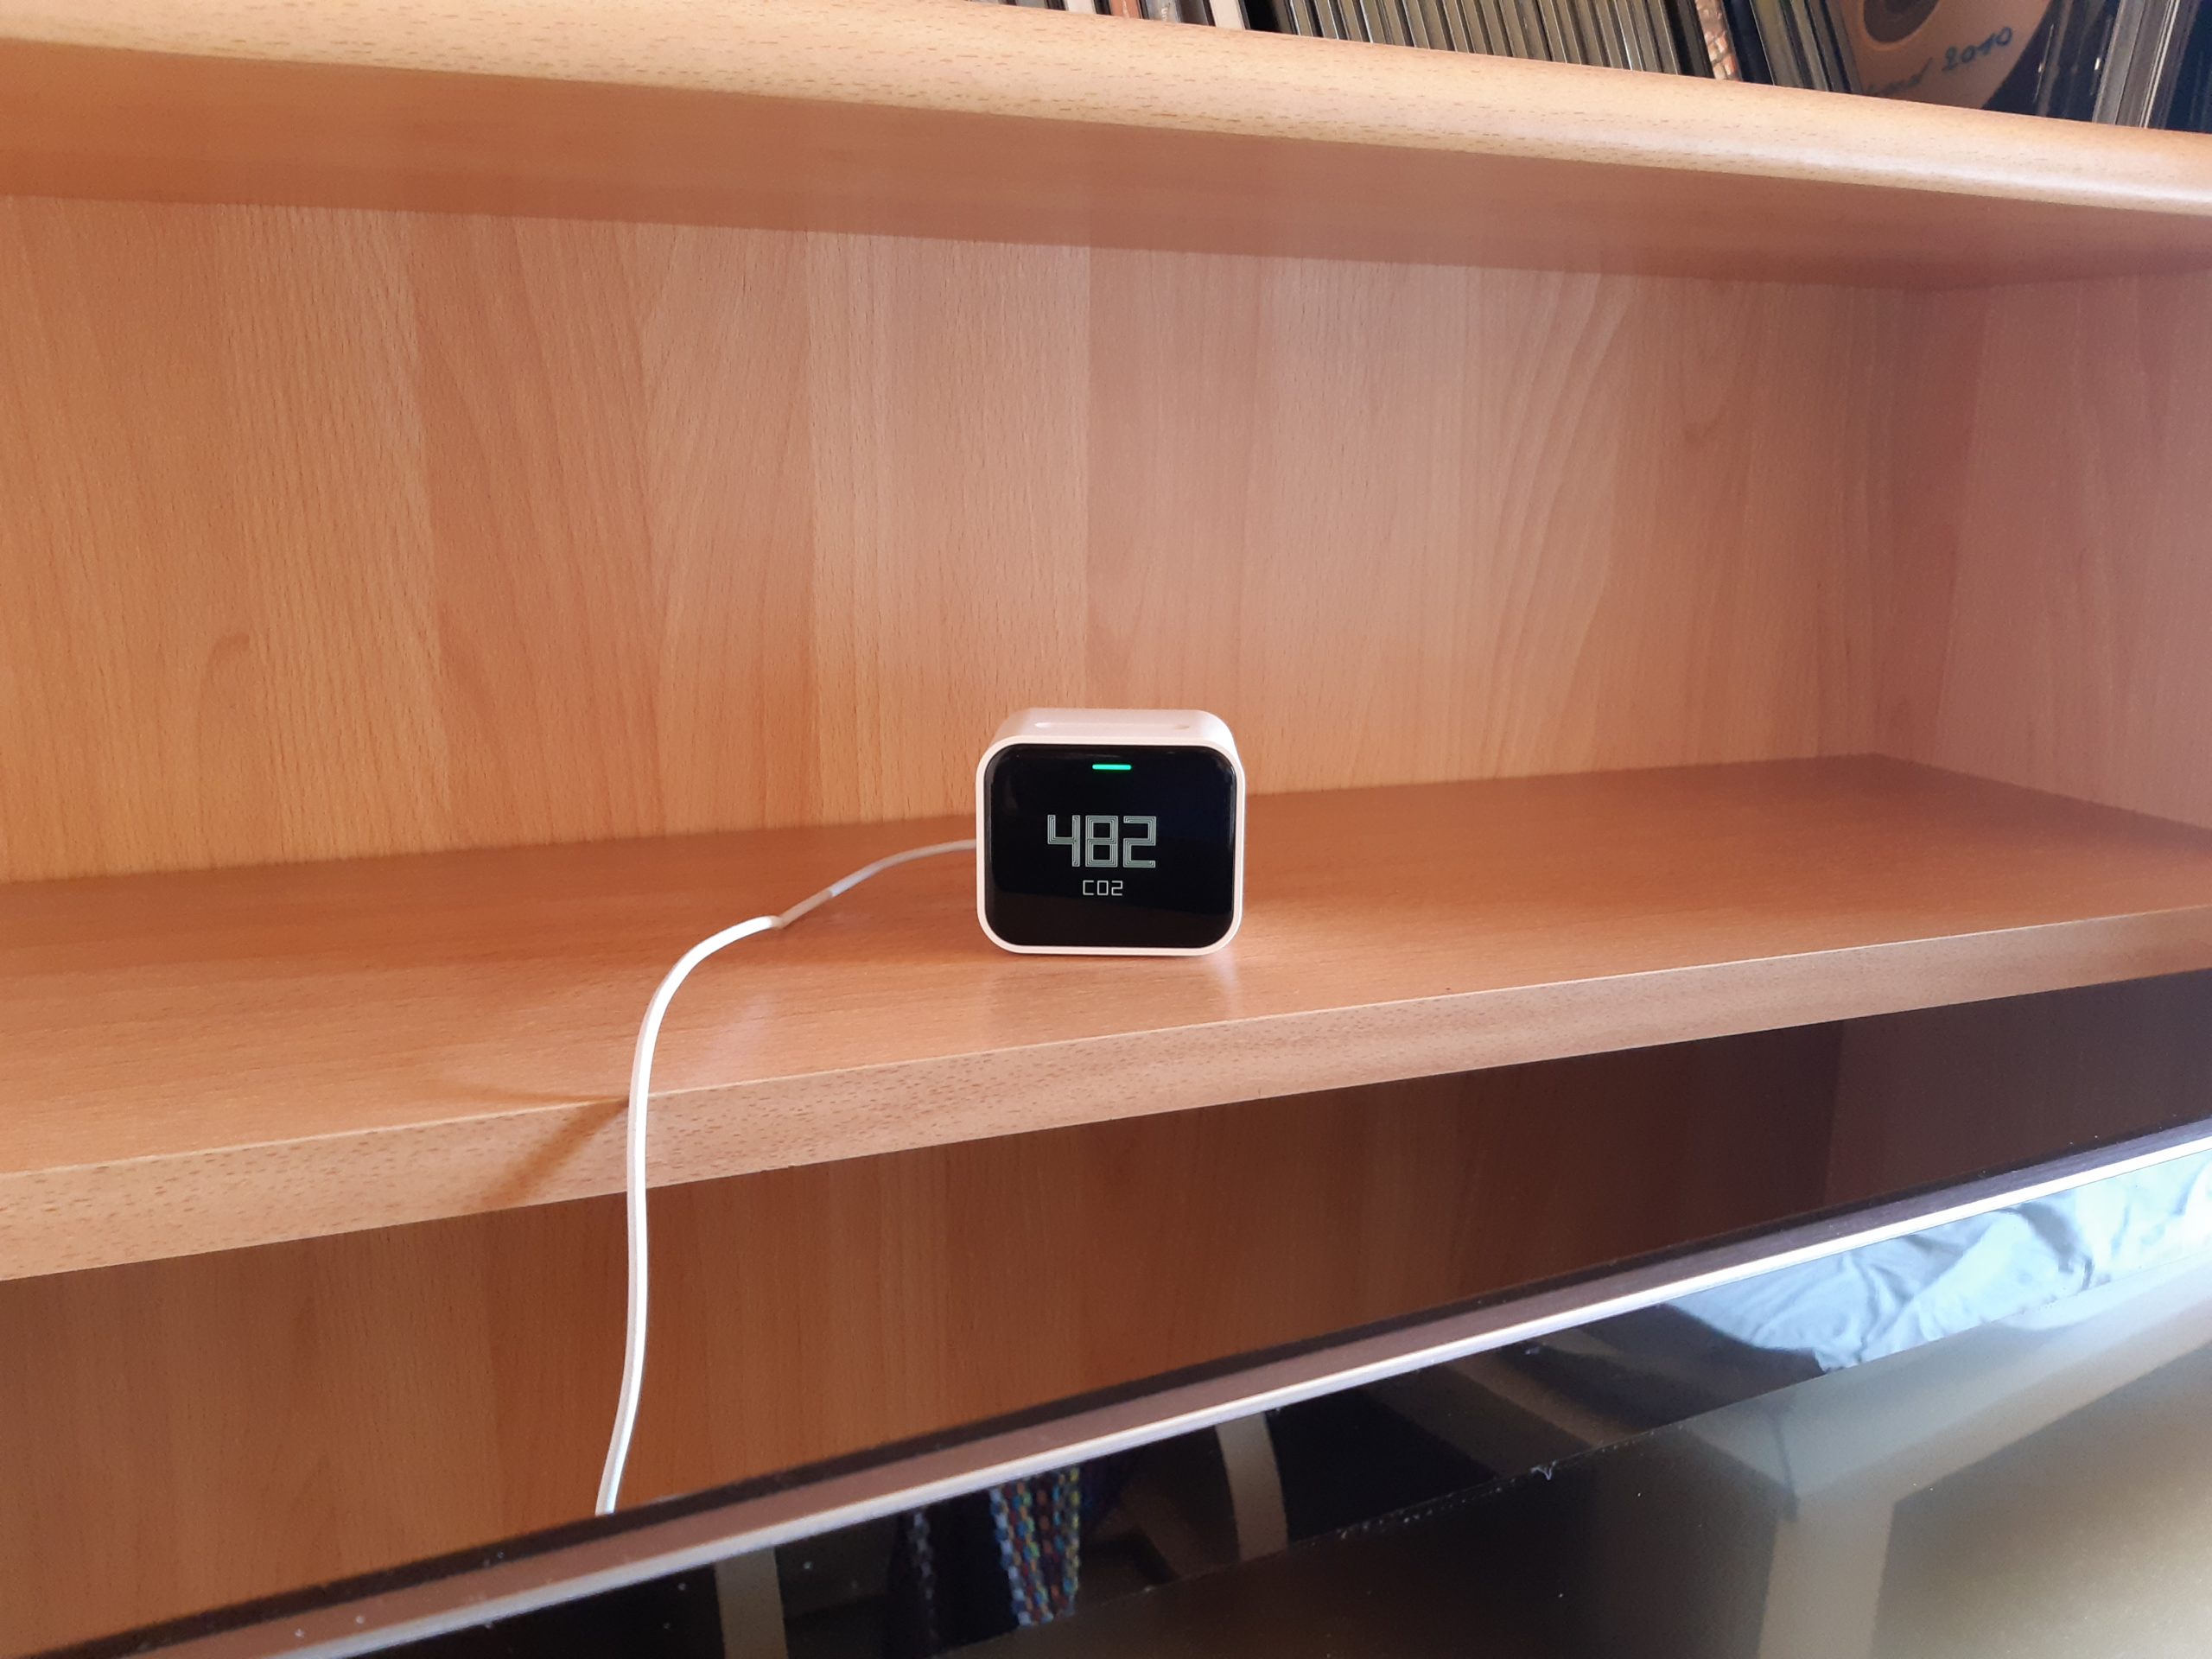
I initially had the ZENNER CO2 sensor for monitoring the CO2 level on the right rear corner of my desk, which turned out to be too close to where I was sitting. That’s why I then put him on the opposite side of the room, so to speak, behind me. Due to the increased distance and placement in the middle of the room, the measured values should now be significantly more representative of my office. A little tip: in order not to be dependent on the battery (lasts approx. 1 day), place the sensor in a place where it can be connected to a power source.
GatewayPLUS SMART for Data Transmission
In addition to the sensors, you also need an IoT gateway that receives and forwards the measured values. At least if, like me, you want to be notified when certain thresholds are reached using a tool like the B.One Gallery. If not, the cool thing about the ZENNER CO2 Indicator is that you can also use it as a standalone device without LoRaWAN®. Personally, however, I use the ZENNER GatewayPLUS SMART, which can be easily integrated into your own WLAN at home to establish LoRaWAN® reception.
Installation of the Sensors in the B.One Gallery
If you ordered your sensors in the ZENNER shop with the ZENNER IoTPLUG&PLAY comfort option, as I did, then the devices are already created and visible to you in the B.One Gallery after delivery and log-in. Provided you have also purchased a ZENNER IoT GatewayPLUS with this option, with which you receive the license for use and thus access to the B.One Gallery. If, on the other hand, you want to use sensors that you have already used before (provided they are also compatible with the B.One Gallery), the manual installation is also child’s play. If required, you can find detailed instructions in the B.One Gallery Howto: Add Sensors.
Thresholds and Notifications
When setting up notifications for critical status changes, I used the value ranges from the article “IoT in Homeoffice & Office: Healthy Indoor Climate with the Help of LoRaWAN® Part 1 – Basics & Sensors” as a guide. These are summarized as follows:
- CO2 level:
- < 800 ppm → normal value = good air quality
- 800 – 999 ppm → slightly higher value = average air quality
- 1,000 – 1,399 ppm → increased value = poor air quality
- >= 1,400 ppm → very high value = very poor air quality
- Temperature: recommended range 19°C to 25°C
- Relative humidity: recommended range 30% to 60%
- Illuminance/amount of light: recommended minimum value 500 lx (no maximum limit)
In the article ” B.One Gallery Howto: Set up & Manage Notifications ” you will learn how easy it is to create them.
Experiences regarding CO2 Monitoring
In order to monitor the CO2 level, I set up the following notifications in the B.One Gallery:
Notification 1: CO2 level rises above 1,000 ppm + reminder if no change after 0.5 h
Notification 2: CO2 level rises above 1,200 ppm + reminder if no change after 0.5 h
Notification 3: CO2 level is no longer above 1,000 ppm
Notification 4: CO2 level is no longer above 1,200 ppm
Why the two threshold values of 1,000 and 1,200 ppm? On the one hand to be informed when I get into a value range that is no longer ideal (1,000 – 1,399 ppm) and on the other hand when I am approaching the value range at which I should really ventilate at the latest (> = 1,400 ppm). Why not have a notification above 800 ppm? Because a value between 800 and 1,000 ppm can be regarded as slightly increased, but is still completely harmless and ventilation is not really necessary here. In addition, the 800 limit is exceeded very quickly and often for me if I don’t have the window open all the time.
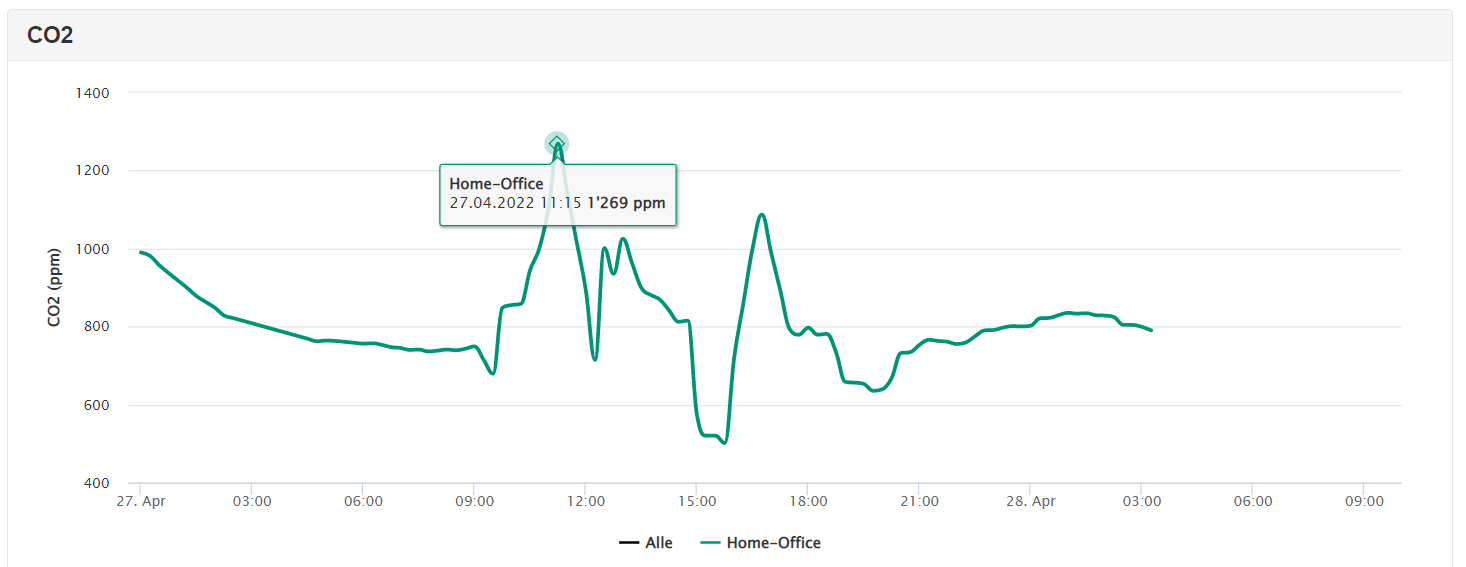
In practice, I got along quite well with this setting after I had found a suitable location for the CO2 Indicator. At first, as already mentioned, I placed it in the top right corner of my desk, which was too close and in too direct a breathing direction. As a result, I had reached a value of over 1,000 ppm extremely quickly and frequently, which corresponds to a high CO2 value and therefore poor air quality. According to this, I could/should have aired almost every 15 minutes and the amount of notifications in my email inbox got a little out of hand. After repositioning the CO2 Indicator on the other side of the room, i.e. further away from me and no longer in the direct direction of my breathing, things looked better. The number of notifications received was now more manageable as it now takes a little longer to reach or exceed the 1,000 ppm threshold. How long exactly? With the window and door closed and without leaving the room in between, usually between 30 and 45 minutes. With a very low initial value of between 500 and 600 ppm after extensive airing, sometimes between 1 hour and 1.5 hours. How long did I have to ventilate to get back into the green zone below 800 ppm, i.e. good air quality? Usually about 3 to 5 minutes. I only rarely got into the red zone of over 1,399 ppm, in which airing is then urgently recommended at the latest and which corresponds to very poor air quality, and also not every day. The same applies to values of over 1,200 ppm. Of course, this can look completely different for you, depending on the size of the room and whether you share your homeoffice or office with others or not.
Another exciting observation: when I only opened the window for a longer period of time instead of opening it fully, the CO2 level still slowly increased. This confirms that tilting a single window for ventilation does absolutely nothing, at least as far as the CO2 level is concerned. The situation is different, of course, if you have several windows open and this creates a draft in the room.
Experiences regarding Temperature Monitoring
I set up the following notifications to monitor the temperature:
Notification 1: Temperature drops below 19°C + reminder if no change after 1 hour
Notification 2: Temperature rises above 25°C + reminder if no change after 1 hour
Notification 3: Temperature is no longer below 19 °C
Notification 4: Temperature is no longer above 25 °C
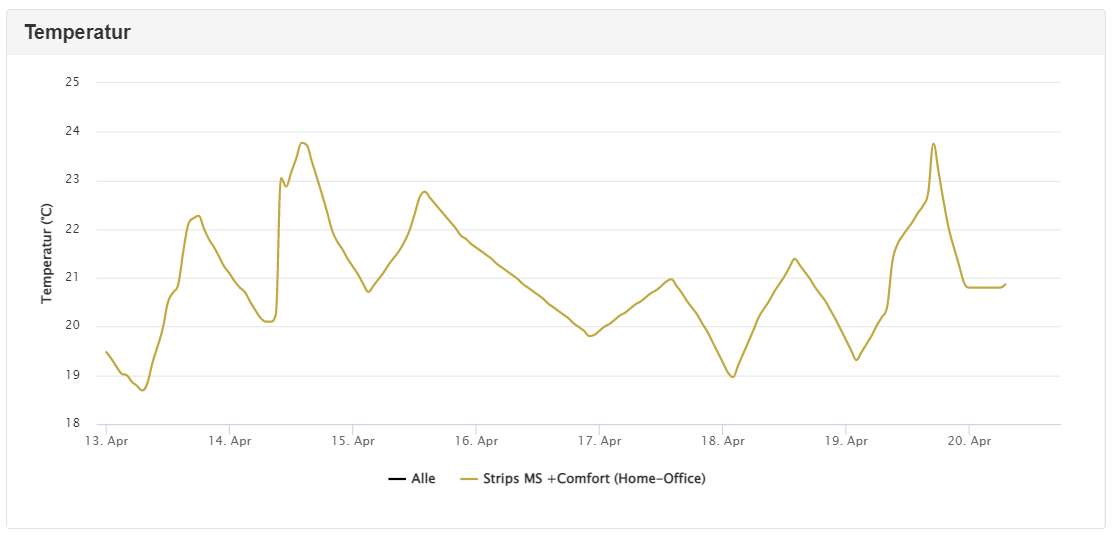
This was or is actually practicable for me. Due to the fact that the temperature in my office has remained in this value range most of the time (see also the following screenshot of an example week), the notifications are accordingly limited. This can of course change, especially in the cold winter months.
You might be wondering why, in contrast to the CO2 level, I only let myself be notified again after an hour if the values have not returned to normal by then? Quite simply because for me the CO2 level is a much more important factor for a healthy room climate than the room temperature, which in my view primarily affects subjective well-being. In addition, I run less risk of getting too many notifications.
So you now know how I place the two sensors used in my office, at which threshold values I get a notification and what my experiences are with monitoring the CO2 level and temperature. The next post is about the parameters relative humidity and amount of light, I’ll tell you whether my ventilation behavior has actually changed and finally what my overall conclusion is 🙂


Responses