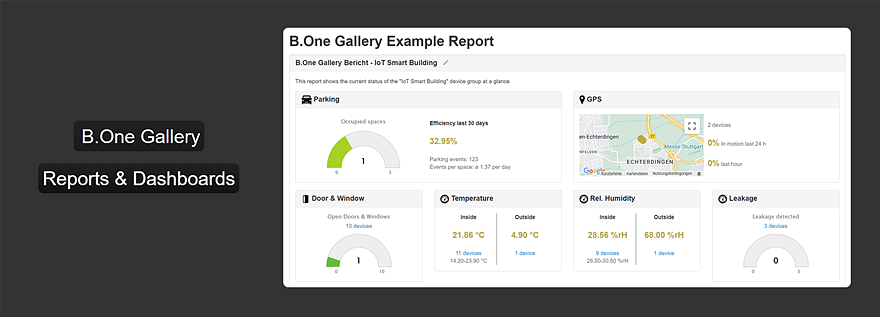
In the B.One Gallery you can create customized graphical reports and dashboards from your sensor data and share them with your colleagues, partners, customers or service providers. We will show you exactly how this works and what such a report can look like.
What are customized Reports?
Customized reports are overviews of selected dashboard views and/or time charts of your sensors that you have created yourself. They are always useful if you either need other overviews than the ones you find out-of-the-box in the “Dashboard” and “Charts” tabs in the device groups or if you want to share them with other groups of people. In addition, you have the option of displaying current actual data together with time history data at a glance in customized reports. How exactly you structure such a report is largely up to you. For example, you can bundle according to certain sensor types or thematically. Here are a few examples for inspiration:
Report with the data of all sensors in the building or smart building
Report with the status of all fire doors in the building
Report with the status of all (oil) tanks on the site
Report with data from all sensors on the site
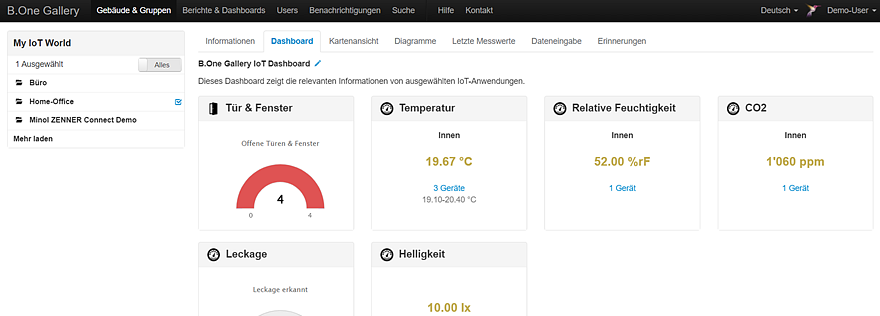
Report with the indoor climate data of office/meeting rooms
Report with leak status across multiple buildings or device groups
Where can you find the customized Reports?
You can find the customized reports via the horizontal main navigation at the top under the menu item “Reports & Dashboards”:
B.One Gallery: Menu item "Reports & Dashboards" in the main navigation
How do you create a new Report?
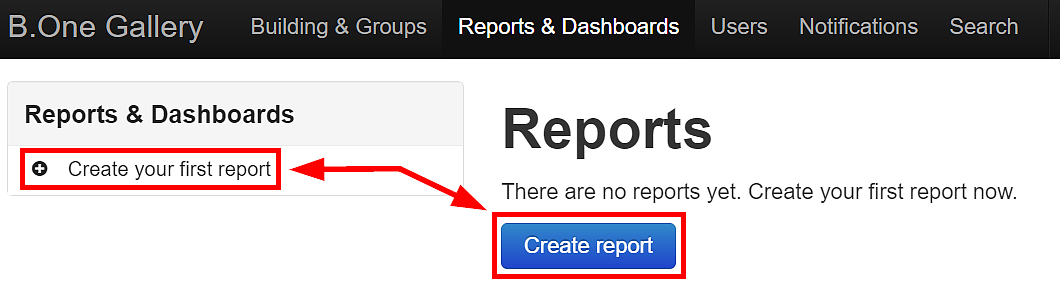
If you haven’t already created a report, here’s what you’ll see first:
B.One Gallery: Create new Report
1. Create a new Report
The “Create your first report” button on the left or the “Create report” button on the right takes you to the wizard for creating a new report:
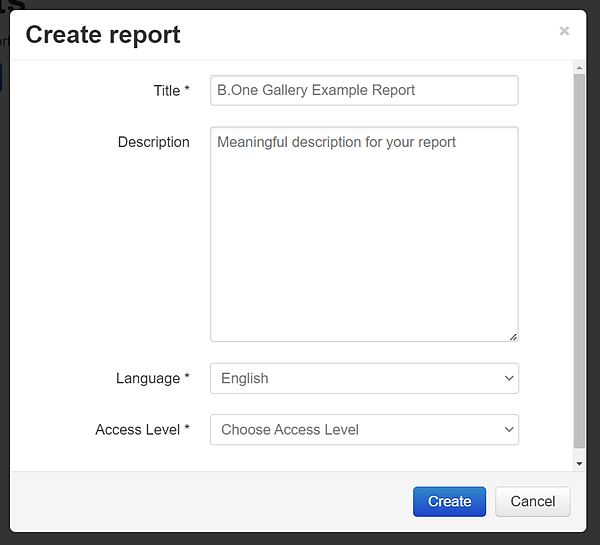
B.One Gallery: Add meta information to new report
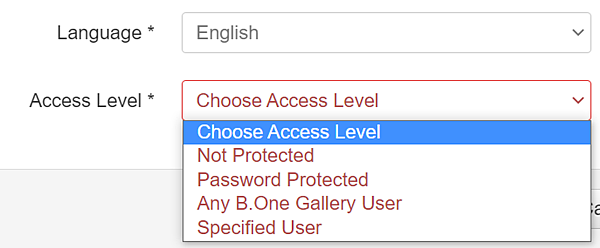
Here you should enter a meaningfultitle and a suitabledescription. You can also choose the language and the access level. The former is self-explanatory, for the latter the following four options are available:
Not Protected = anyone who knows the link to the generated report has access to it, including non-B.One Gallery users
Password Protected = only people who know the link to the created report and the password you provided have access
Any B.One Gallery User = all B.One Gallery users who know the link to the created report have access to it
Specified B.One Gallery Users = only B.One Gallery users who know the link to the created report and who have been explicitly selected by you have access to it (authorized readers must be logged in)
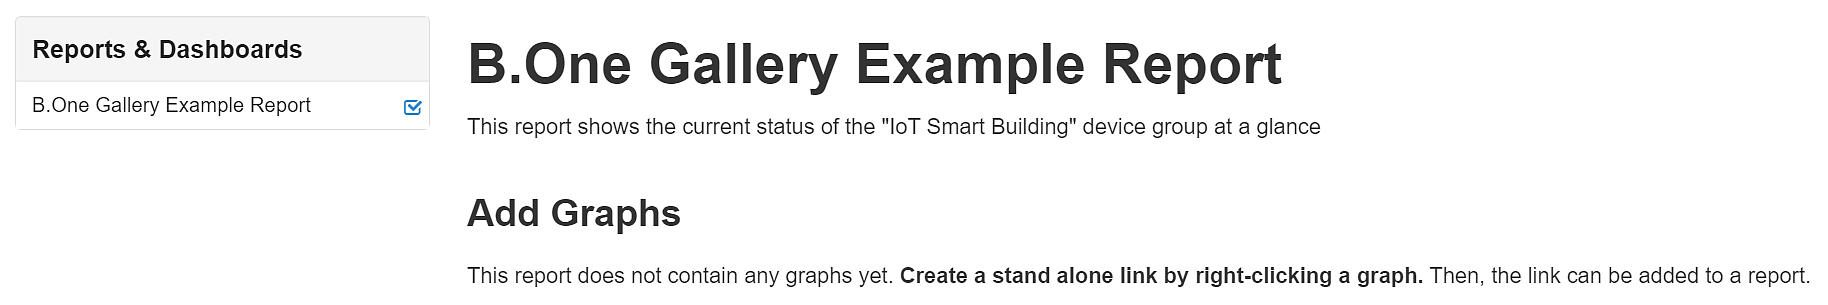
After the report has been created by clicking on “Create“, it now appears under “Reports & Dashboards” on the left side, but is initially empty:
B.One gallery: Select access level for new report
B.One Gallery: View after creating a new (empty) report
2.Fill the Report with Views
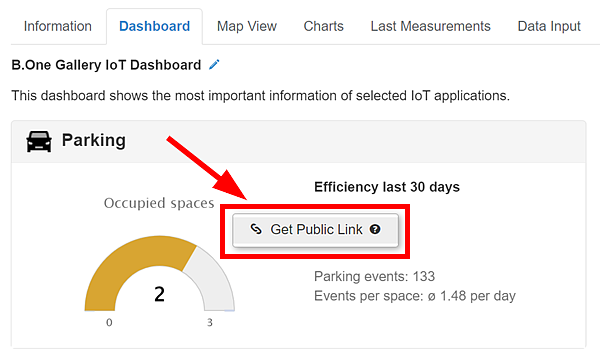
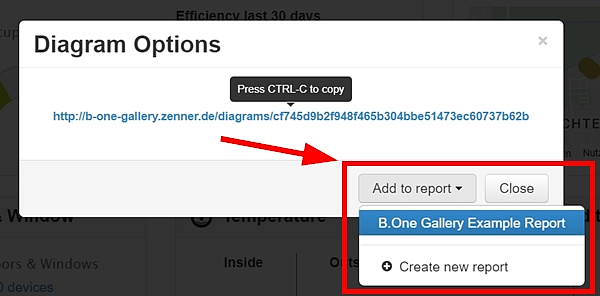
To fill your report, you now add the dashboard views and/or charts that you want to include in it. To do this, call them up in the corresponding device group via the “Dashboard” or “Charts” tab and right-click to open the context menu. This will create a “public” link for the selected view, which you can add to your previously created report using the dropdown menu below:
B.One Gallery: Create public link of a dashboard view for report
B.One Gallery: Add public link of a dashboard view to report
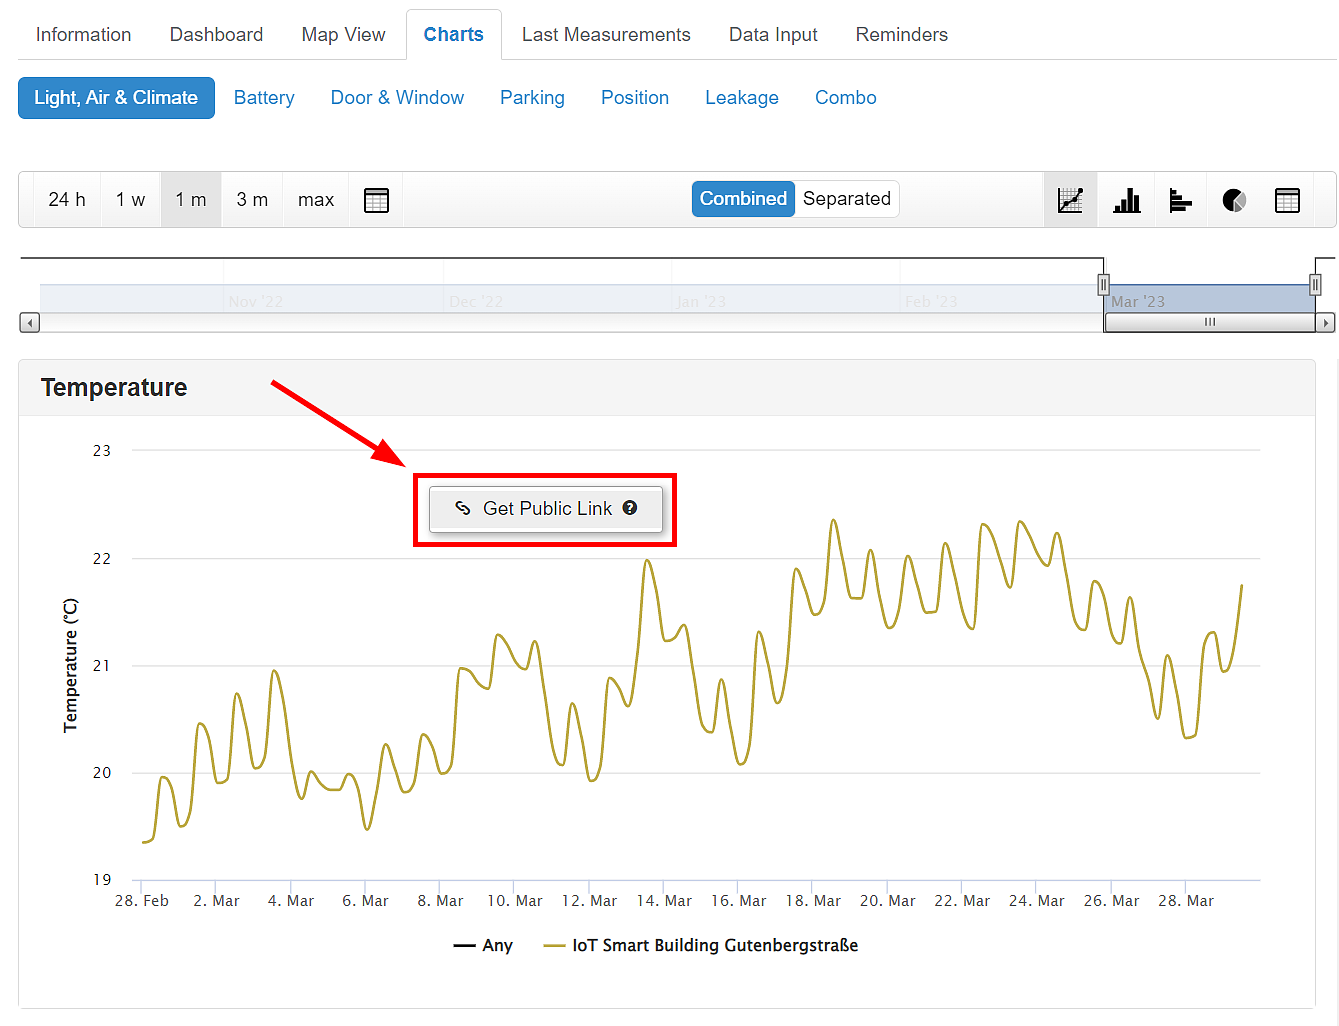
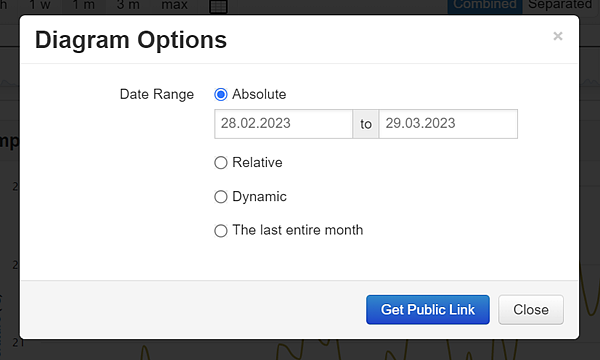
If you create a link to a chart that you add to your report, you can additionally set various parameters for the time range to which the displayed values should refer:
B.One Gallery: Create public link of a chart for report
B.One Gallery: Set time period of a chart added to a report
Absolute = the displayed values only refer to the selected period and are not updated
Relative = the displayed values are updated regularly and always refer to the selected period, e.g. the last 30 days
Dynamic = the displayed values are updated regularly and always refer to the period from the selected date to today
The last entire month = the displayed values always refer to the last full month
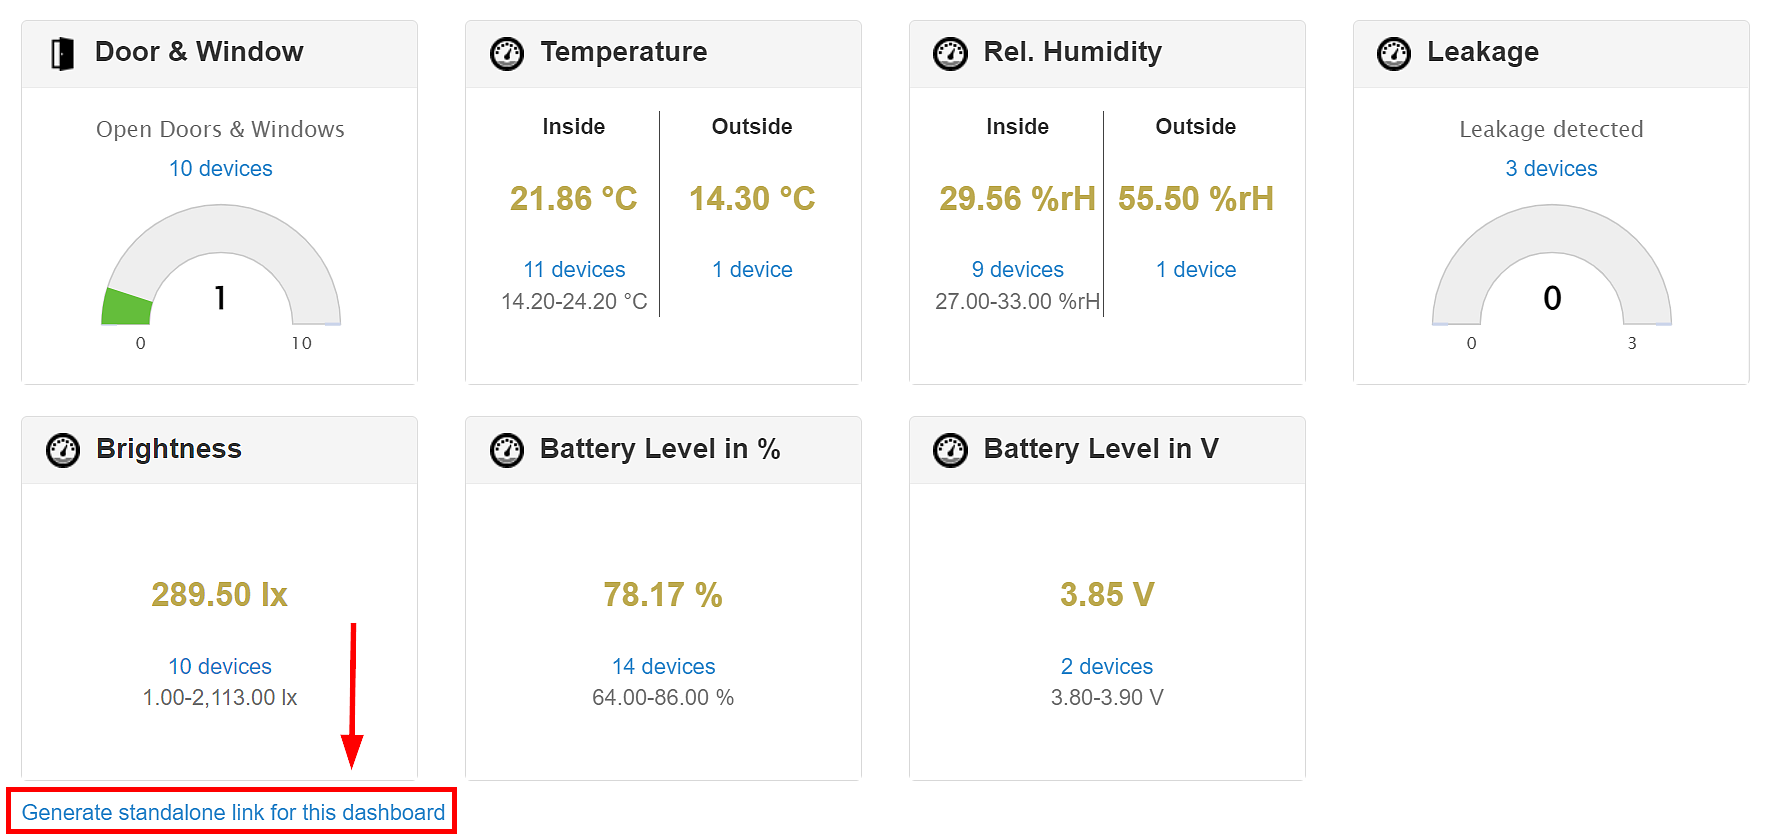
As an alternative to single dashboard views or charts, you can also select entire device groups or multiple devices and simply use the link below to share the entire currently displayed dashboard view with others or add it to your report:
B.One Gallery: Add complete dashboard view to report
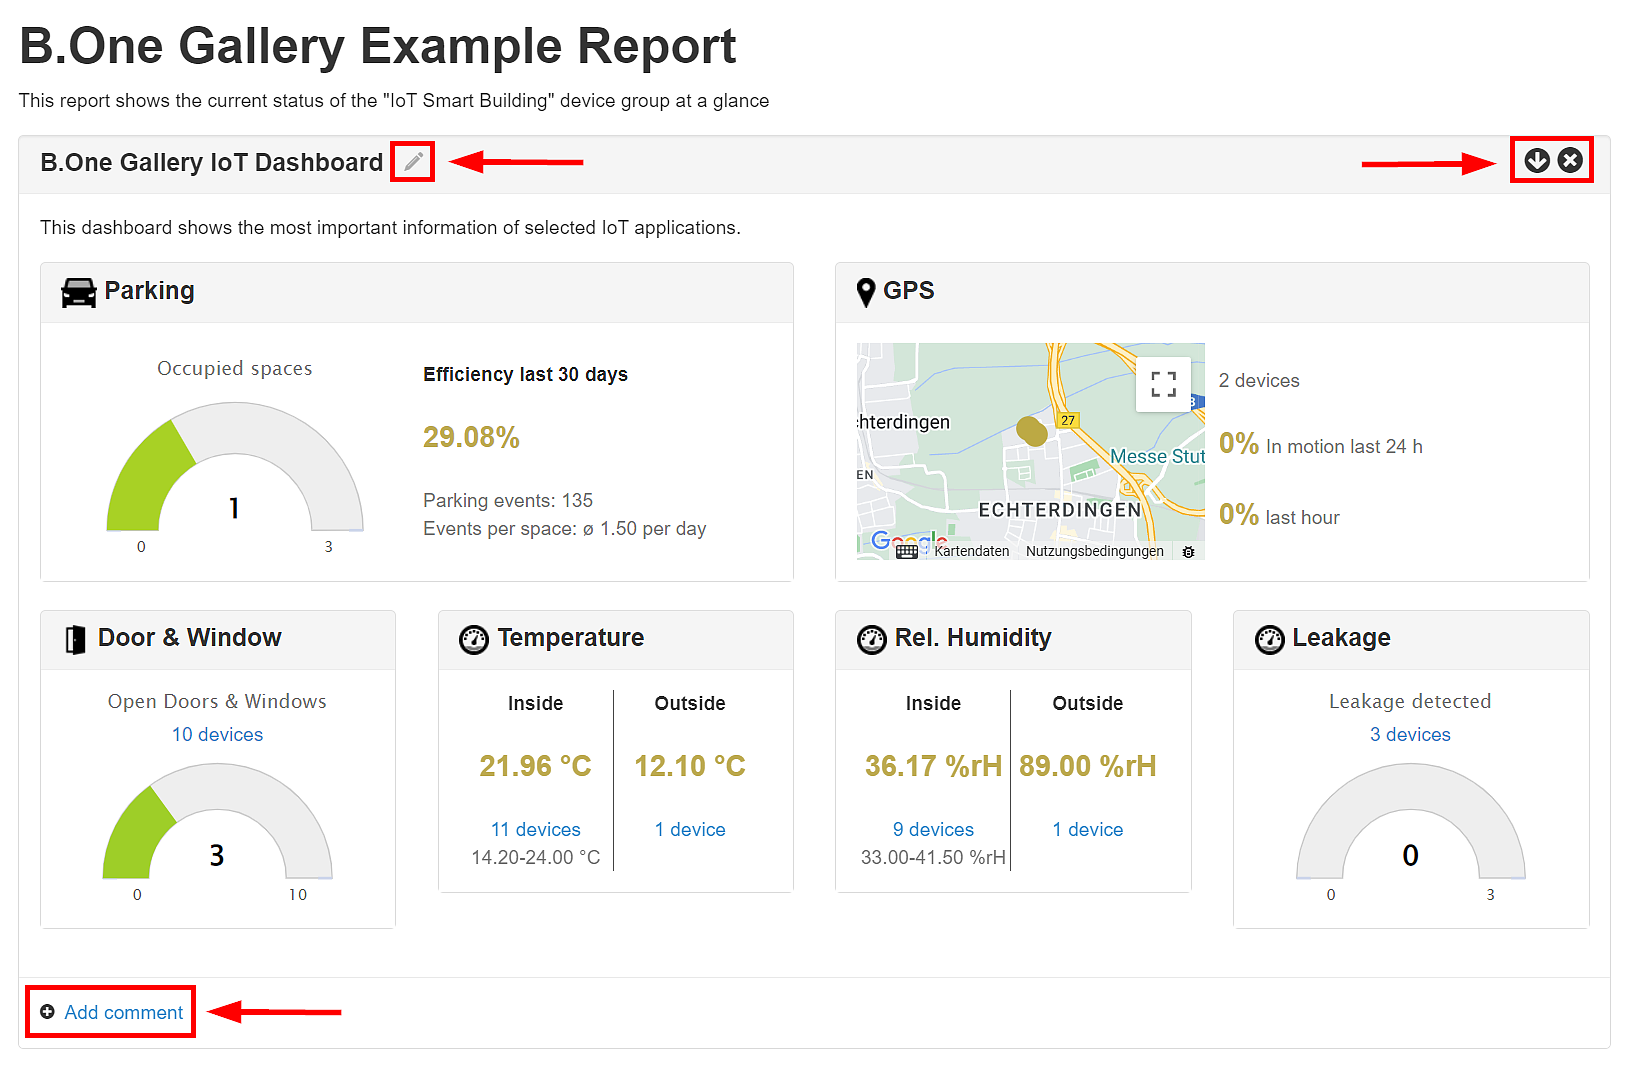
3. Customize Report
After selecting the dashboard views and/or charts, you can customize your report a bit if needed. You can adjust the order of the different views, change the headings, add helpful comments or delete views again.
B.One Gallery: Customise created report
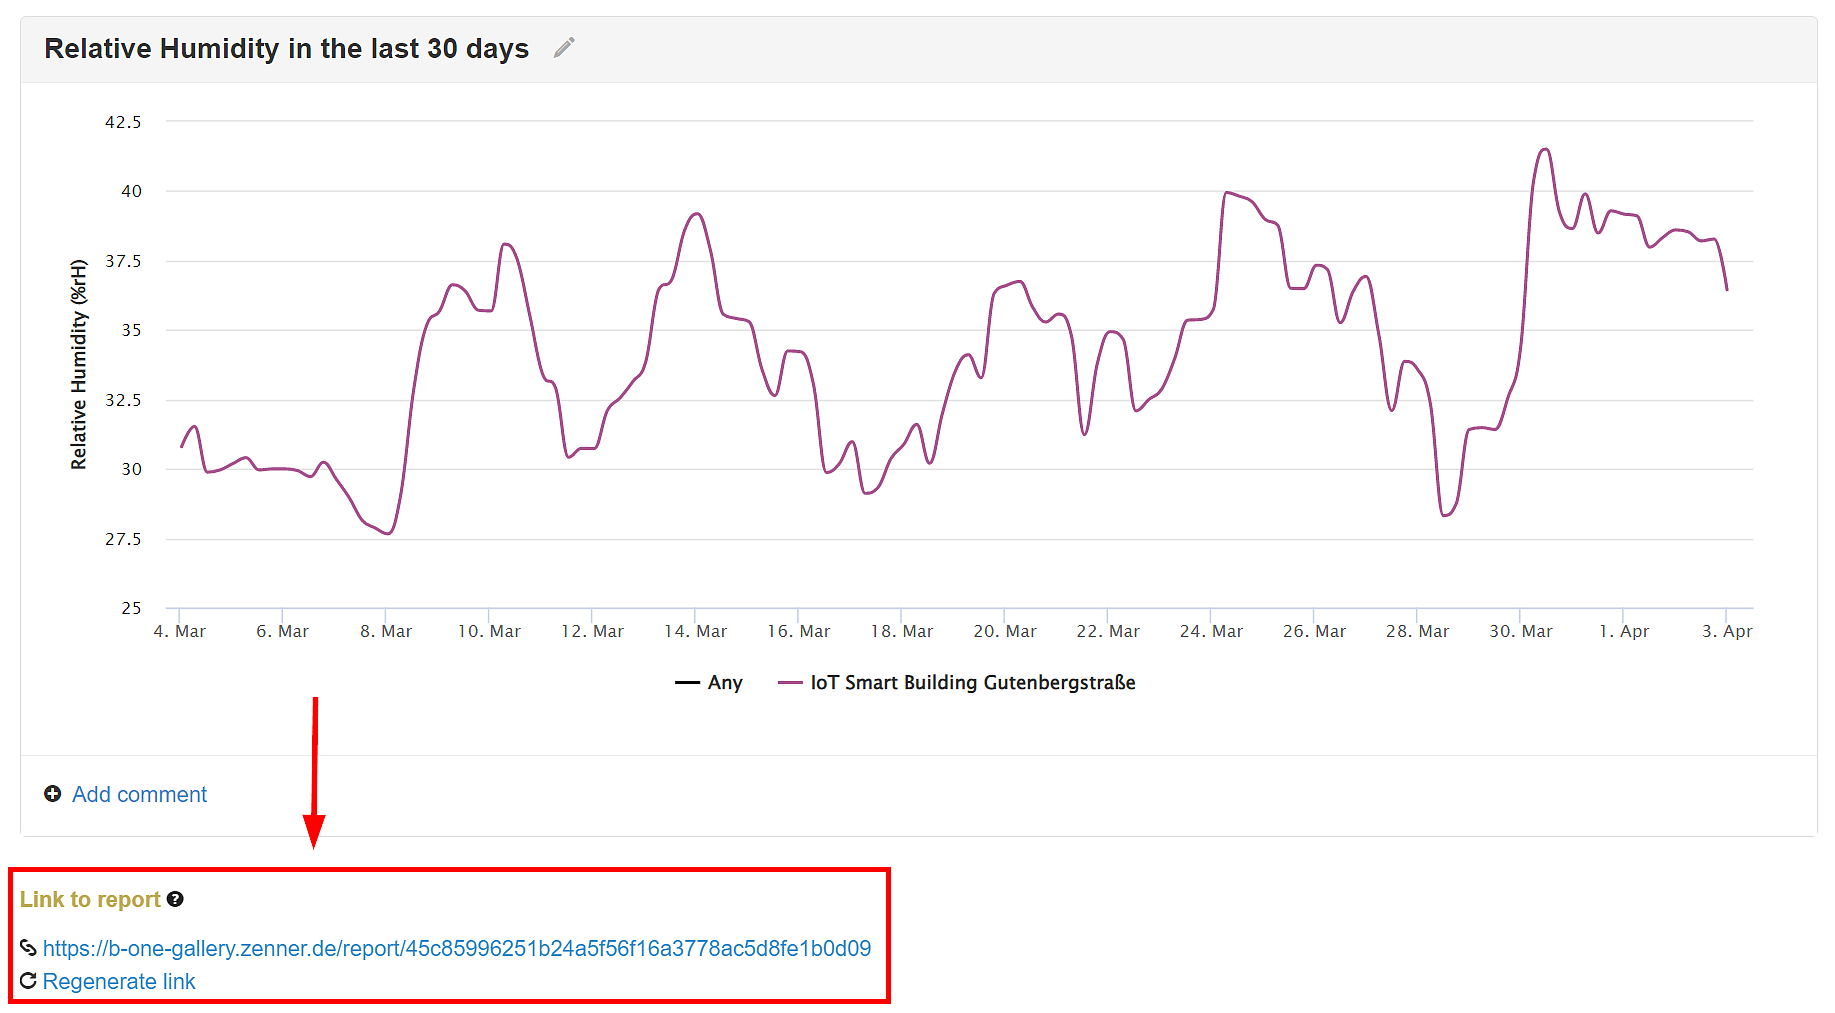
4. Share Report with Others
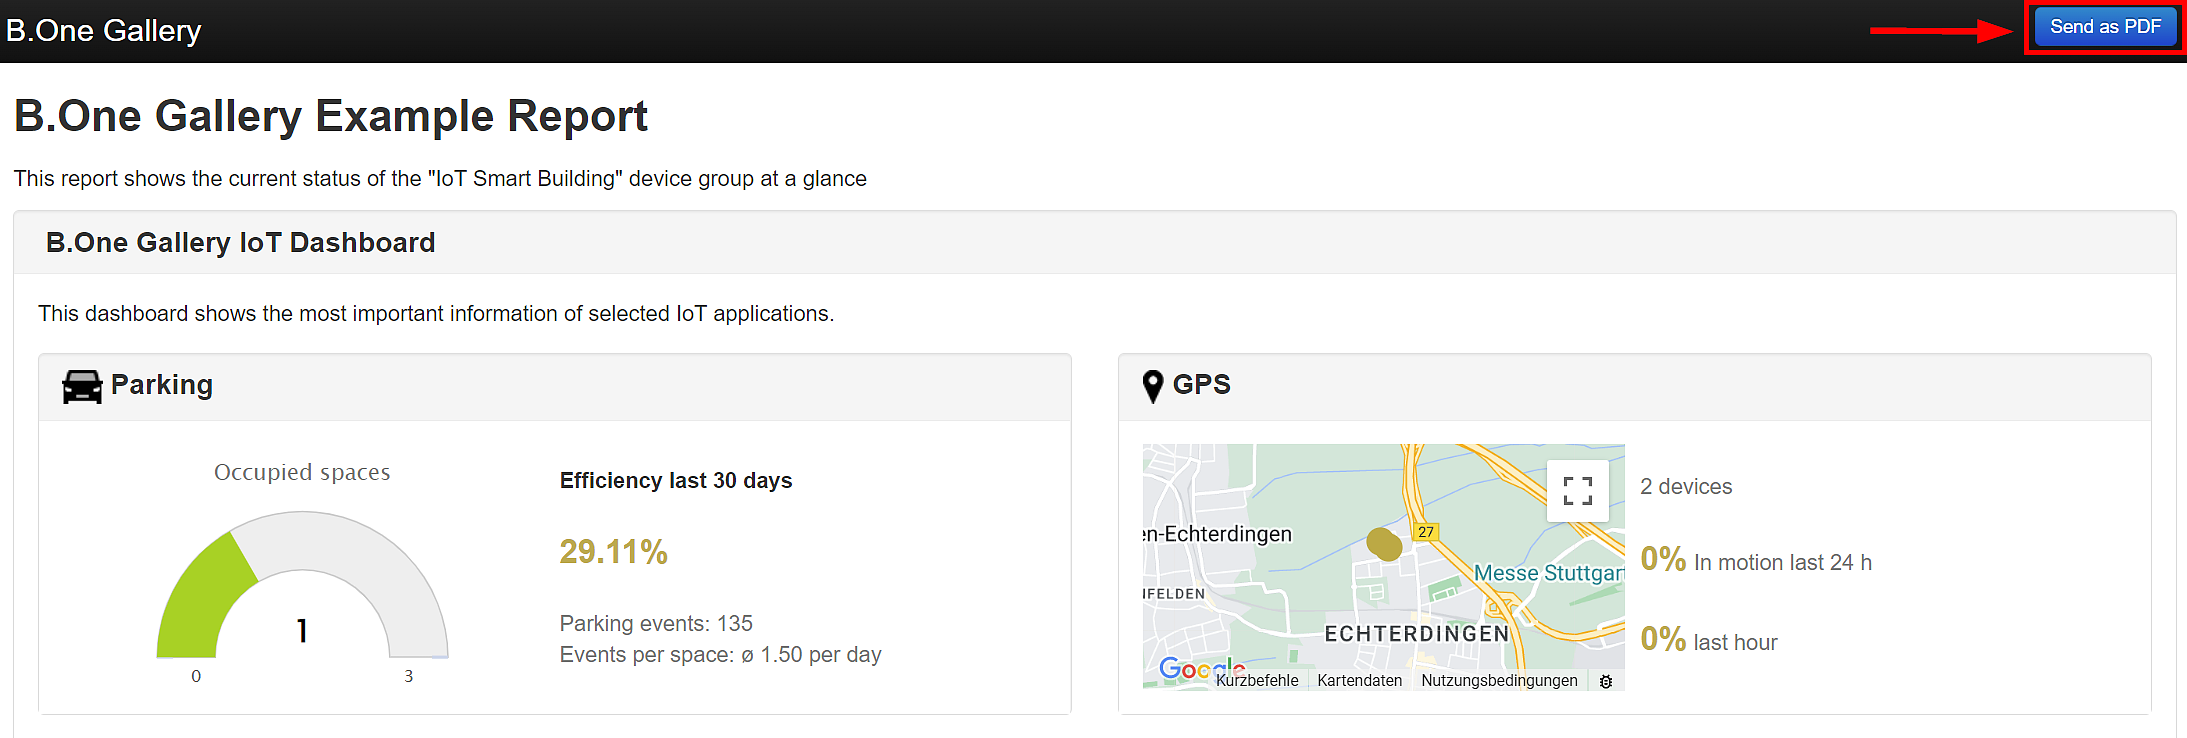
You can now access your finished report at any time directly via the link below and share it with others. If required, you can also save it as a shortcut on your desktop or smartphone. Also practical: You can use the “Send as PDF” button at the top right to send a PDF document of the report – either once or automatically on a daily, weekly, monthly or yearly basis.
B.One Gallery: Share Report via Public Link
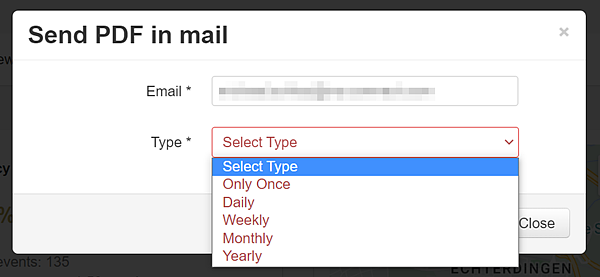
B.One Gallery: Send report via email as PDF
B.One Gallery: Send report as PDF - Select send cycle
Do you have any questions or suggestions for improving reports and dashboards in the B.One Gallery? Then simply post them here directly below the article or use our B.One Gallery Forum.
– 📖🕓 ≈ 10min – You have purchased access to the B.One Gallery visualization tool, but are now wondering where exactly you can find what? Our Quick Guide – B.One Gallery provides the answer to this question and gives an overview of the areas and functions of the tool.
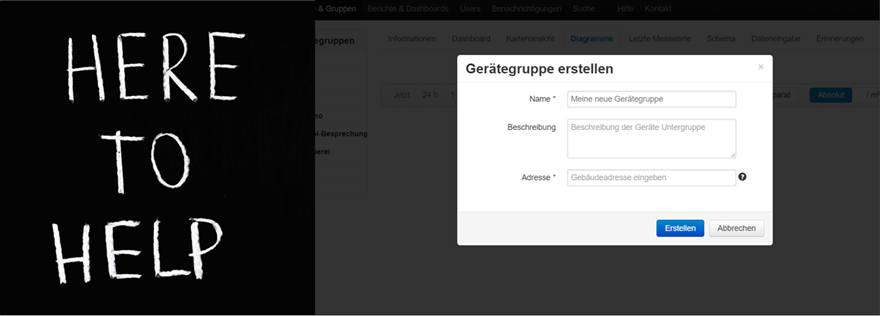
– 📖🕓 ≈ 7min – Are you wondering what device groups are in the B.One Gallery, what are they good for and how can you create and manage them? You can find the answers in this post.
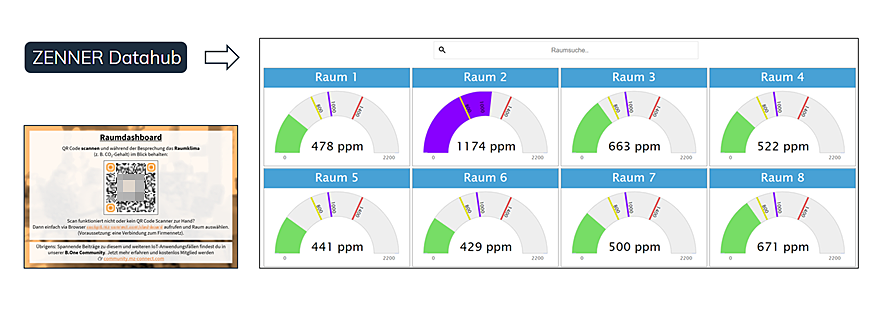
– 📖🕓 ≈ 7min – [Update des ursprünglichen Artikels vom 22.07.2022] The use of LoRaWAN® sensors in combination with a dashboard is ideal for monitoring the indoor climate in meeting rooms. That’s why we’re presenting a small series of articles that show you what a self-programmed indoor climate dashboard tailored to individual requirements based on the ZENNER Datahub IoT platform can look like.
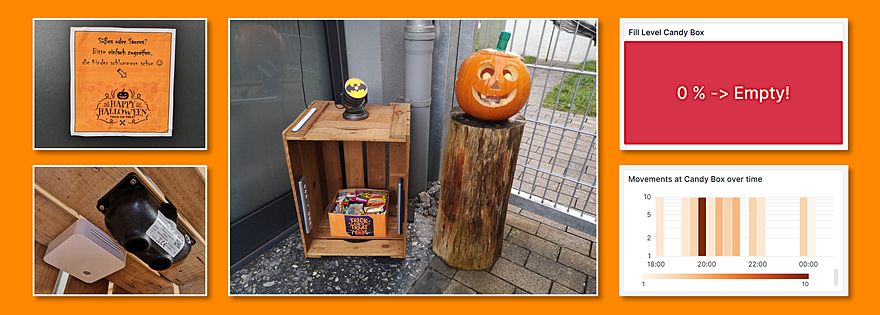
– 📖🕓 ≈ 8min – Recently it was time for “trick or treat” again on Halloween. This year with LoRaWAN® house entrance monitoring. Find out more about the implementation, the results and other lessons learned.
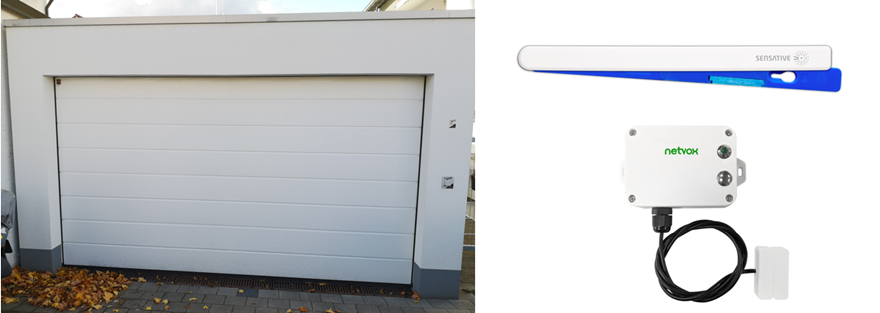
– 📖🕓 ≈ 9min – Last modified on 11th April, 2024 As recently announced, I would like to use the example of two LoRaWAN® sensors and the B.One Gallery visualization…
In order to provide you with the best possible user experience and offer, we use cookies on our website that are not only technically necessary but also serve to analyse access. By clicking on 'Accept all' you agree to this. You can find more detailed information and how to revoke your consent at any time in our Privacy Policy. (Decline)
Our website uses cookies to help us improve our website and provide you with the best possible service. These cookies are necessary and cannot be disabled. We also use cookies to analyse the traffic on our website. By clicking on 'Accept', you agree to our cookie policy:

Responses