B.One Gallery Howto: Getting started
This article is intended to simplify your start with the B.One Gallery.
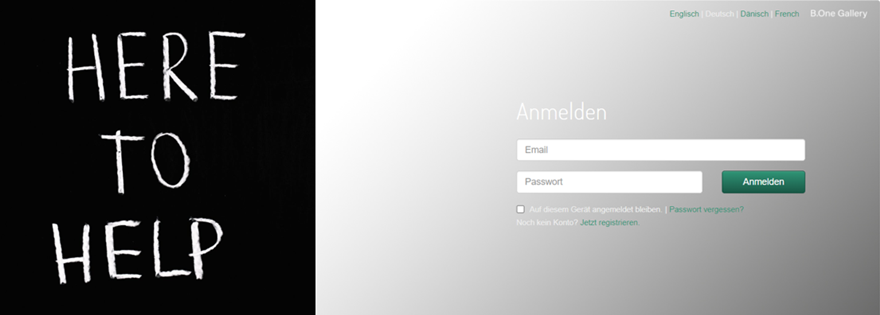
When you ordered your IoT GatewayPLUS in the ZENNER Shop I IoT Sensors & Solutions with the ZENNER IoT PLUG&PLAY comfort option, you received an invitation to the B.One Gallery. To log in you need to create a user account. Follow the link from the e-mail or use the link to the B .One Gallery in the menu on the left and adopt the log-in data from the e-mail.
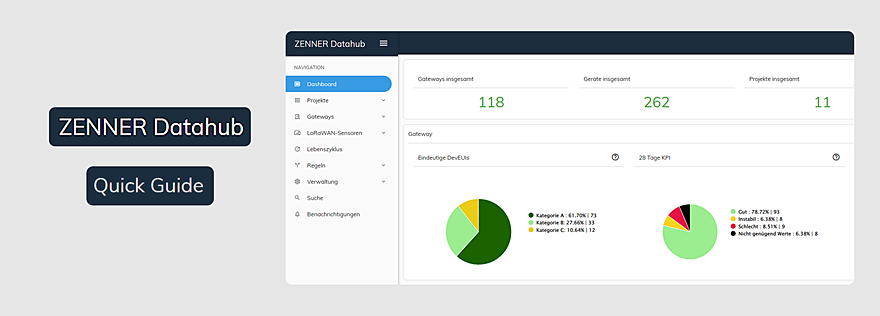
If you order sensors with the aforementioned ZENNER IoT PLUG&PLAY Option, these are already created for you in the B.One Gallery and are immediately visible after your first log-in. If you ordered your sensors without ZENNER IoT PLUG&PLAY or if you are already using your own, you must first create your sensors manually after logging in for the first time. Follow the instructions from the blog post ” B.One Gallery Howto: Create sensors ” by Boris. To create an account, you will need the additional account details of the ZENNER Datahub, which you received by email from the shop team.
After successfully logging in, you will then see an overview of all data for folders and buildings that have already been created. In this view you will not see any sensor data yet
If you have multiple projects in your gallery, you must make a selection to see details about that project.
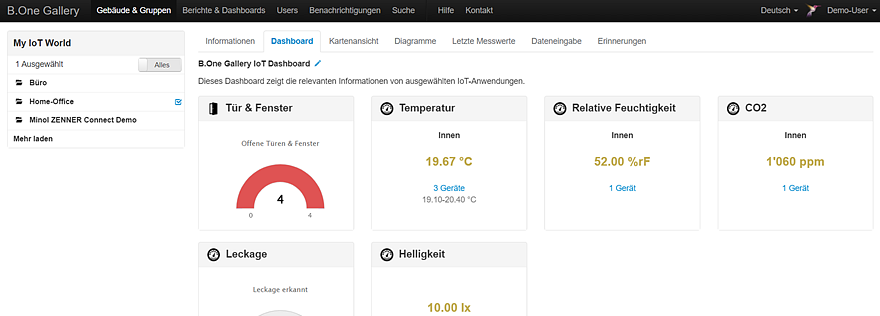
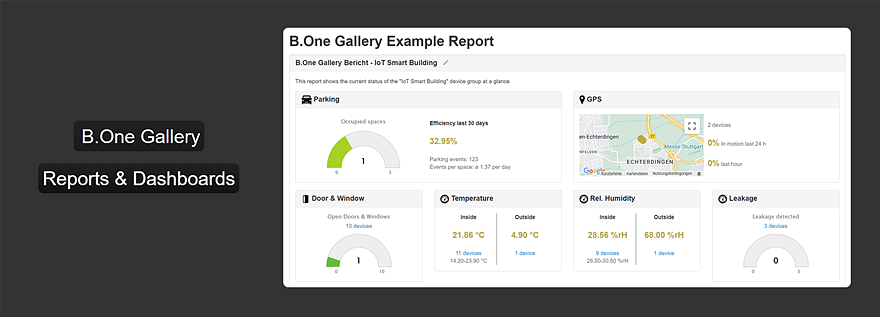
Under the “ Dashboard ” tab you will find the most concise information about your projects. The dashboard fills up automatically depending on the sensors used. If you have a sensor with GPS, for example, you will also see it here on a map.
Behind the ” Diagrams ” tab is the graphical processing of the measured values. Here you can customize the shape, content and timeline of the charts to your liking. You can also right-click a chart with others from here.
Here is an example of the visualization of a temperature curve in the gallery


Responses